

POST
The SEO Content Compression Experiment

Table of Contents
Foreword
Within the SEO industry we are fortunate that many ideas and theories are shared which can help develop everyone's understanding of complex topics and result in a good volume of interesting debate.
As you engage with the SEO community you will find no shortage of discussion surrounding what does and doesn’t work when it comes to improving the organic rankings of a given website. This is perhaps one of the best things about working in this space.
However, there is also the tendency within the industry to accept ideas, especially more complex and/or advanced technical ones, without extensive testing and individual experimentation.
For over a decade at Reboot Online we have prioritised experimentation, resulting in an extensive collection of internal and publicly available SEO experiments and research pieces which have put many of the most common SEO myths, theories and misconceptions to the test.
We continue to experiment to learn more about the inner workings of the most popular search engines and AI platforms, and to publish much of our research in the hope that it can move the industry forwards and generate even more insights and debate.
If you would like to discuss our experiments further, and hear a bit about how we might be able to help you accelerate the SEO growth of your website, please get in touch.
Introduction
We know that Google is using many different signals to help determine where a given webpage should rank in the organic search results, and one long-held belief by some SEOs is that content compression could be one such signal.
Several SEOs have shared the theory that if a piece of content can be highly compressed, that is to say that many repetitive/redundant words and phrases can be removed to reduce the overall size of the HTML file, this could suggest that the content is of a lower quality (otherwise it would contain a greater ratio of unique words and phrases, meaning that the HTML file couldn’t be compressed as much).
On the surface, this theory is a logical one.
Indexing the entire internet and ranking results for billions of search queries each and every day takes a staggering amount of resources, not to mention the environmental impact associated with this enormous task.
The idea that looking at things like compression ratios to help determine not only content quality, but also which pages should or shouldn’t be crawled (and/or recrawled) and indexed to begin with, is an intuitive one.
Doing so could help search engines allocate valuable resources more effectively, and reduce energy/resources being wasted on lower quality pages and content.
If true, this practice would also mean that we could automate content quality checks by looking at the compression ratios of our own content relative to the ratios of the webpages ranking top for our target keywords.
When doing so, if we found that our pages could be compressed to a greater extent than the top ranking ones, this could suggest that Google would find the same and deem our content lower quality than the competitors. If this were the case, it could greatly impact our ability to rank for our target keywords.
Given the clear opportunity presented to develop a bespoke tool to help with these kinds of automated content quality checks and competitor comparisons, if the content compression theory were proved to be true, and what this would mean for our largest-scale SEO campaigns, we were keen to put the theory to the test.
That is why we developed this study and carried out this analysis, and the results (which we will outline below) were surprising to say the least.
Our Hypothesis
Once we decided that we wanted to put the content compression theory to the test, we first needed to confirm the hypothesis that we were looking to prove or disprove.
After some internal discussions with our data team, we arrived at the following hypothesis:
Methodology

Since in this study we were interested in determining if and how major search engines like Google could be using compression ratios in their algorithms to infer content quality and influence rankings, we knew that our analysis should involve looking for a correlation between compression ratios and search engine position.
From the outset, we also knew that we would need to look at a large number of webpages and search results when carrying out this study.
Finding that strong rankings for a small sample of keywords in a single industry correlated with a smaller compression ratio wouldn’t be nearly enough for us to confidently determine if content compression ratios are being used at a large scale to influence the organic search results.
So, we devised a methodology that would look at compression ratios and any correlation between these and search engine rankings across multiple markets and industries.
The first step in carrying out this study was building out our seed list of keywords and webpages to analyse.
Seed List
To build our seed list, we came up with 15 different industries and looked at 20 different keywords within each, across 6 different markets.
Our analysis spanned the below markets:
- UK
- US
- FR
- AU
- CA
- DE
The keywords for each industry looked like this: “[keyword] [country]”.
For example, one keyword used within the gaming industry was “VR France”.
The full list of industries and keywords can be found below:
| Industry | Keywords |
|---|---|
| Finance | Investment, Cryptocurrency, Banking, Wealth Management, Stock Market, Risk Analysis, Financial Planning, Loans, Credit, Accounting, Auditing, Taxes, Assets, ROI, Bonds, Insurance, Portfolio Management, Equity, Fintech, Capital |
| eCommerce | Online Shopping, Dropshipping, Marketplace, Product Listing, SEO, Digital Marketing, Payment Gateway, Fulfillment, Customer Retention, Conversion Rate, Cart Abandonment, Multichannel Selling, Logistics, Mobile Commerce, Inventory Management, AI Personalization, Reviews, Affiliate Marketing, Analytics, Omnichannel |
| Travel | Tourism, Booking, Flights, Hotels, Travel Insurance, Itinerary, Cruises, Travel Agencies, Adventure Tours, Group Travel, Backpacking, Luxury Travel, Eco-tourism, Vacation Rentals, Destination Marketing, Budget Travel, Sightseeing, Online Travel Agencies, Loyalty Programs, Travel Tech |
| Gaming | eSports, Game Development, Streaming, Virtual Reality, Mobile Gaming, In-App Purchases, Multiplayer, Game Engines, Indie Games, Console Gaming, Cloud Gaming, NFTs, Game Monetization, Player Engagement, DLCs (Downloadable Content), AI in Gaming, Augmented Reality, Leaderboards, Game Studios, Subscription Gaming |
| Technology | AI, Machine Learning, IoT, Cybersecurity, Cloud Computing, SaaS, Blockchain, Big Data, Robotics, AR/VR, Software Development, 5G, Digital Transformation, Edge Computing, Automation, Smart Devices, IT Infrastructure, DevOps, Data Science, Green Tech |
| Healthcare | Telemedicine, Patient Care, Pharmaceuticals, Medical Devices, Healthcare IT, Diagnostics, Preventive Care, Biotech, Electronic Health Records, Medical Billing, Wellness Programs, Hospital Management, AI in Healthcare, Remote Monitoring, Clinical Trials, Health Insurance, Public Health, Health Tech, Rehabilitation, Nutrition |
| Education | E-learning, EdTech, Curriculum Design, Student Engagement, Online Courses, Assessment Tools, STEM Education, Certification Programs, Digital Classrooms, Gamification, Lifelong Learning, Teacher Training, Learning Management Systems, Skill Development, Test Prep, Adaptive Learning, Academic Research, Virtual Learning Environments, Blended Learning, College Admissions |
| Real Estate | Property Listings, Mortgage, Rental Market, Real Estate Investment, Home Appraisals, Commercial Property, Real Estate Agents, Virtual Tours, Zoning Laws, Property Management, Housing Market Trends, Home Staging, Land Development, Foreclosures, Luxury Real Estate, Open Houses, Leasing, Real Estate Tech, Construction, Sustainability in Real Estate |
| Retail | Point of Sale, Merchandising, Inventory Management, Brick-and-Mortar, Loyalty Programs, Retail Analytics, Supply Chain, Store Layout, Discounts, Retail Trends, Consumer Behavior, Personalization, Omnichannel, Visual Merchandising, Product Launch, Retail Marketing, Foot Traffic, Customer Experience, Seasonal Sales, Upselling |
| Energy | Renewable Energy, Solar Power, Wind Energy, Energy Storage, Smart Grids, Fossil Fuels, Energy Efficiency, Carbon Neutrality, Oil & Gas, Clean Technology, Nuclear Energy, Geothermal Energy, Energy Trading, Biofuels, Energy Policy, Sustainability, EV Charging, Battery Technology, Energy Audits, Grid Modernization |
| Fashion | Sustainable Fashion, Fast Fashion, Brand Identity, Luxury Fashion, Textile Innovation, Fashion Shows, Trend Forecasting, E-commerce, Ethical Sourcing, Digital Runways, Circular Fashion, Streetwear, Customization, Influencer Marketing, Apparel Manufacturing, Fashion Tech, Retail Analytics, Omnichannel Selling, Fashion Startups, Fabric Design |
| Food & Beverages | Farm-to-Table, Supply Chain, Food Safety, Organic Foods, Packaging, Delivery Apps, Food Trucks, Sustainability, Culinary Trends, Franchising, Menu Innovation, Beverage Technology, Seasonal Menus, Restaurant Management, Plant-Based Foods, Nutritional Labeling, Food Waste Management, Branding, CPG (Consumer Packaged Goods), Subscription Boxes |
| Logistics & Transport | Supply Chain, Freight, Last-Mile Delivery, Fleet Management, Warehousing, Logistics Tech, Route Optimization, Shipping, Customs Clearance, Import/Export, Air Freight, Containerization, Reverse Logistics, Packaging Solutions, Cold Chain, Delivery Drones, Supply Chain Visibility, Freight Forwarding, Cargo Insurance, Green Logistics |
| Automotive | Electric Vehicles, Autonomous Driving, Connected Cars, Vehicle Maintenance, Auto Parts, Dealerships, Car Rentals, Ride Sharing, Hydrogen Cars, Automotive Tech, EV Charging, Luxury Vehicles, Safety Features, Vehicle Financing, Aftermarket, Telematics, Fleet Management, Auto Insurance, Manufacturing, Regulatory Compliance |
| Media & Entertainment | Content Creation, OTT Platforms, Streaming, Film Production, Music Licensing, Influencer Marketing, Ad Tech, Copyright Management, Virtual Events, Gaming, Animation, Sports Media, Podcasting, Digital Publishing, Social Media, Live Concerts, Media Analytics, AI in Media, Event Management, Cross-Platform Integration |
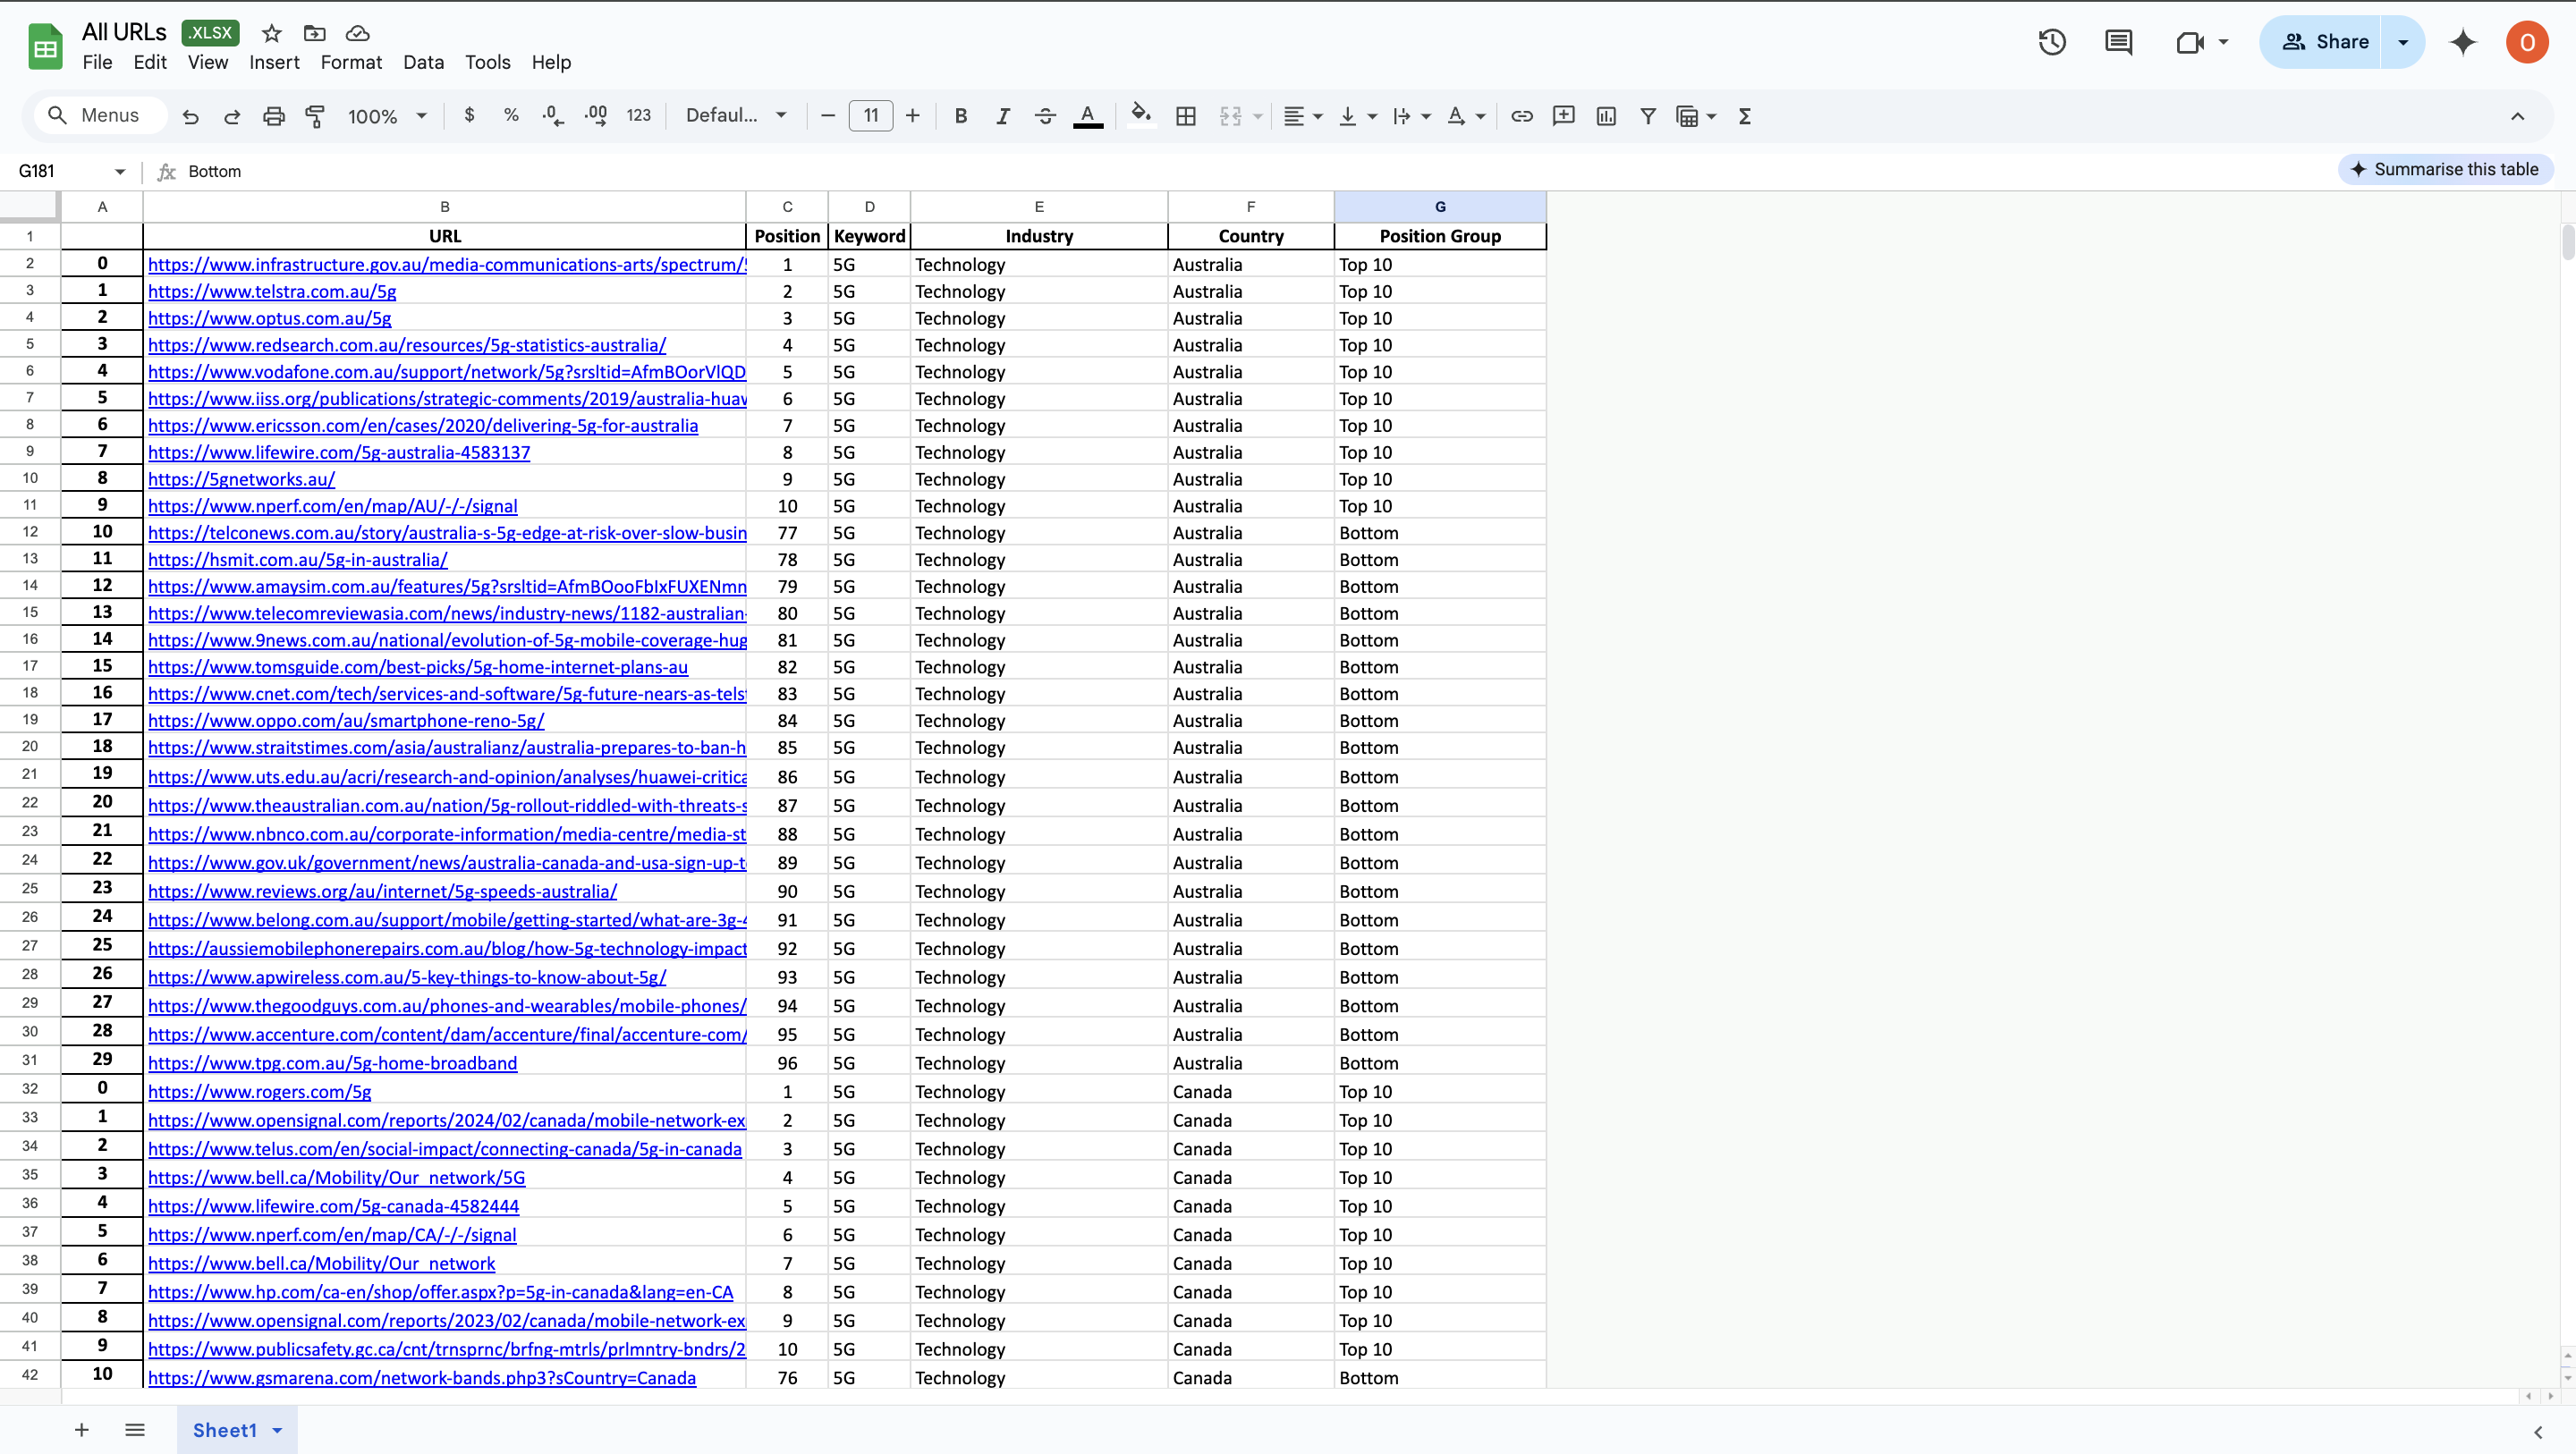
For each keyword, we queried the top 100 organic search results and captured the content found on the pages ranking in the top 10 positions and the bottom 20.
For example, we captured content for the results ranking in positions 1 to 10 and in positions 80 to 99.
When less than 100 results were displayed for a keyword, the second/bottom range was lower, i.e. we captured the content of those webpages ranking in positions 60 to 79 (for example).
For each page captured, the whole text of the page was obtained and cleaned. We did things like removing whitespaces, deleting leftover javascript/HTML, and filtering out other non-relevant artifacts.
The position of each page was also recorded, so we could group them into top 10 or bottom 20 results and reference the organic position of each page later on in our analysis.
Irrelevant results were also removed, including pages where the text suggested errors were present (i.e. “404 error, please try again”), or when functionality on the page was blocking us from getting the actual content (e.g. “Please enable cookies to access this page”). These naturally will have had a low compression ratio and were not relevant to the study.
In all, we collected content from 54,000 websites.
Once we had filtered out the irrelevant ones and removed duplicates, we were left with 42,000 unique pages for our study.
Content Compression
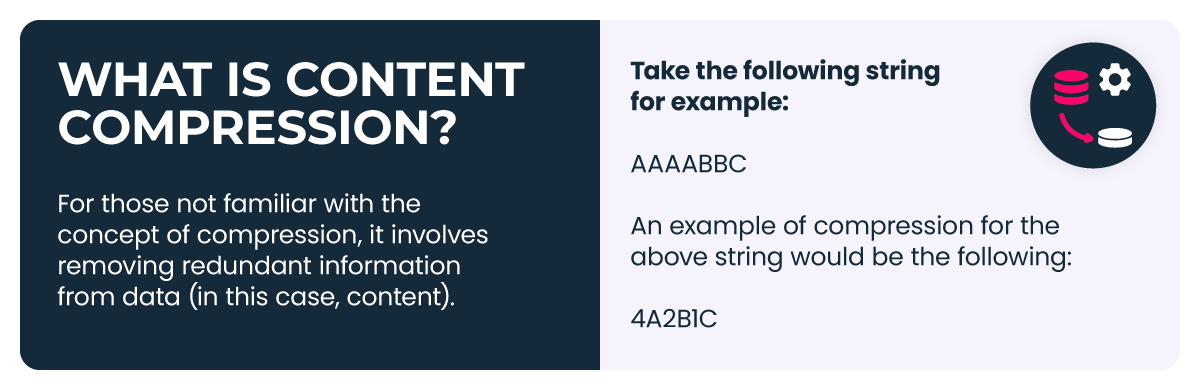
For those not familiar with the concept of compression, it involves removing redundant information from data (in this case, content).
Take the following string for example:
AAAABBC
An example of compression for the above string would be the following:
4A2B1C
In the original string we have 4 letter As, 2 letter Bs, and 1 letter C, so we can remove the duplicate letters and instead simply list how many of each letter is present in the string.
Doing this reduces the length of the stored string, as there are no longer duplicates present, meaning the file size will be reduced slightly.
This encoded data can then easily be decoded and transformed back into the original.
The more redundant and duplicate information contained in the data (in our case this would mean more repeated phrases and/or keywords), the more compressed the content will become.
Next, we looked at the compression ratio for each of our 42,000 webpages.
The compression ratio was calculated for each page by first calculating the size of the original text by looking at the size of the UTF-8 encoded text in bytes.
We then used the Python library GZIP to compress the text found on each page in our sample, whose size was then measured in the same way as the original text.
Finally, the compression ratio was calculated by dividing the original text size by the compressed text size.
A webpage that could be compressed more would have a larger compression ratio, and a webpage that could be compressed less would have a smaller ratio.
Looking back on our hypothesis, we would expect to find that the webpages which had a larger compression ratio would rank less strongly in the organic search results than those which had a smaller compression ratio.
Data Aggregation
The next stage in our study was aggregating the data to check the difference in compression ratios across rankings and industries.
Our data aggregation was done by taking the average of each group.
For each aggregation, each value (cell) had at minimum 900 samples (i.e. the average ratio for the top 10 search results for technology related searches had a sample of 941 pages).
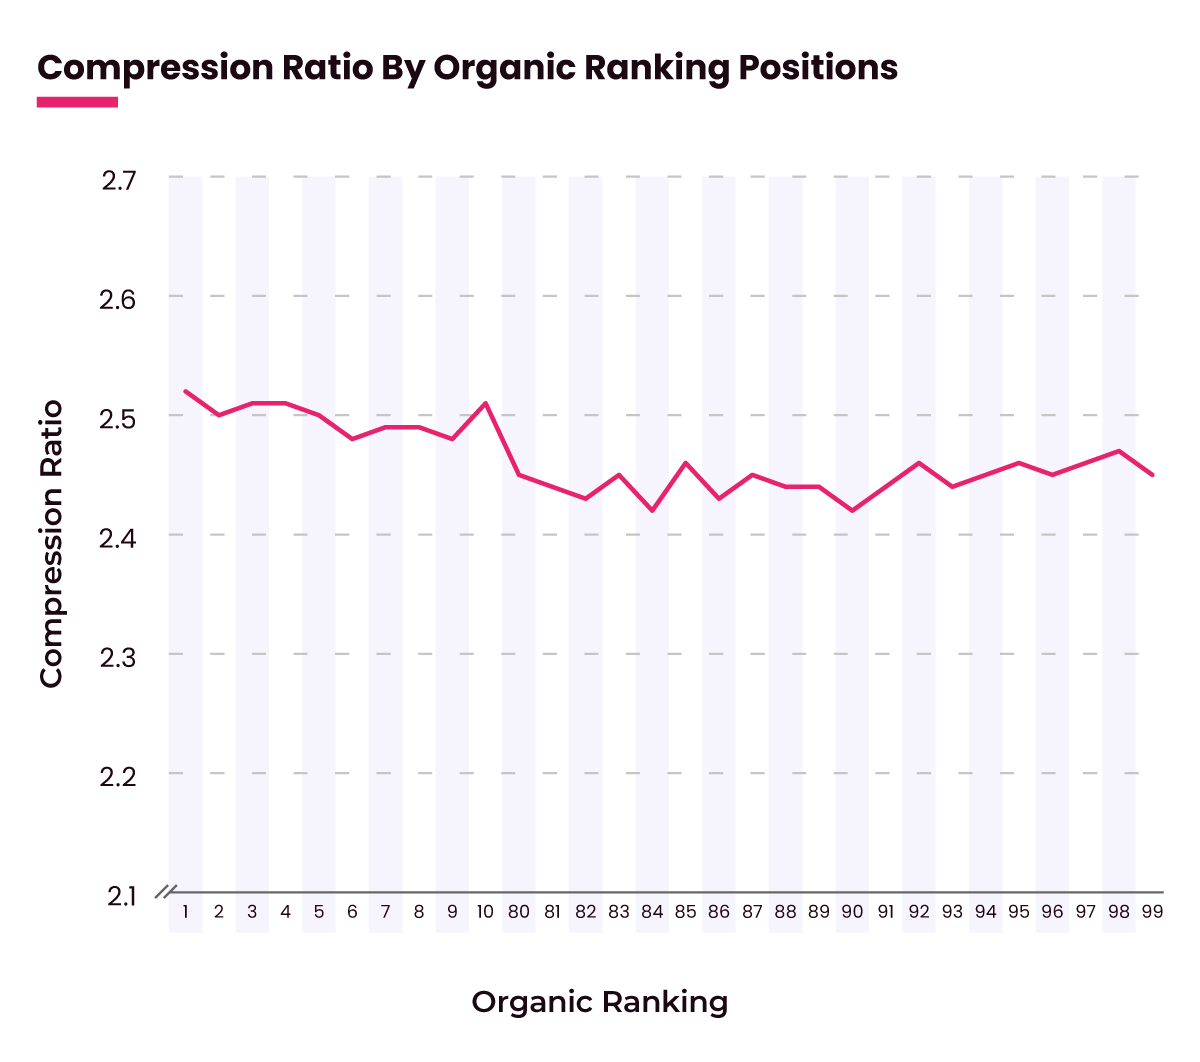
The average compression ratio was also compared by organic position, i.e. the average ratio for all pages in position 1, then 2, then 3 etc. of a Google search were plotted.
Results & Findings
Overall, our study found that compression ratios were actually higher for pages in the top 10 results, by approximately 2%: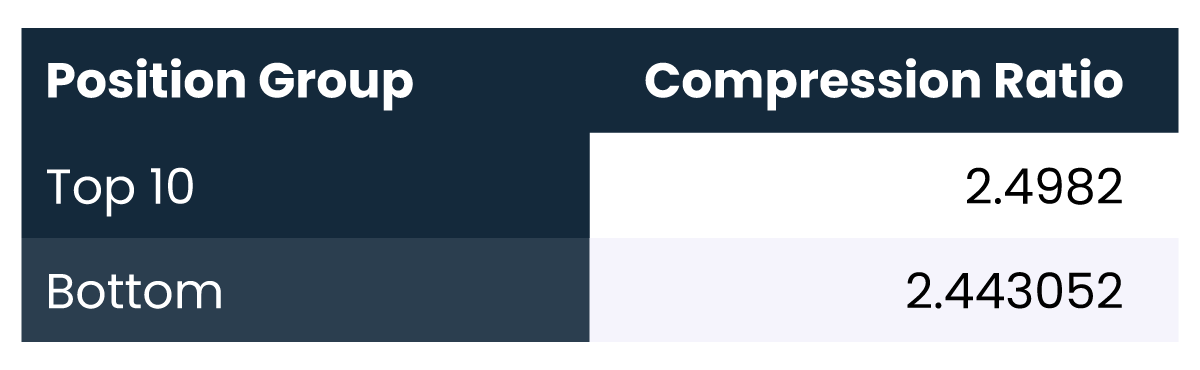
When plotting the compression ratio by organic position, the ratio appears to decrease the further down the organic results you go. This is the opposite of what we would expect if our hypothesis were true.
In short, our analysis found no correlation between compression ratios and organic rankings.
Since most SEOs accept that Google ranks higher quality content stronger in the organic search results, this suggests that compression ratios are not a good indicator of content quality.
We found across all but one industry that the above results remained consistent, meaning across nearly all industries the webpages ranking in the top 10 organic positions had greater compression ratios than those ranking in the bottom 20 positions:
The above trend was also consistent across each market we looked at, with the compression ratios of the webpages ranking in the top 10 organic positions remaining higher than those ranking in the bottom 20 across every market:
While this study did not prove our initial hypothesis, it was very interesting to find that actually the opposite of what you would think would happen was found in our dataset.
This serves to highlight the need to run your own tests and experimentations before adopting any widely shared SEO theory.
To read about some of other SEO experiments click here, and please do get in touch if you would like to discuss this study (or any of our other ones) and how we can help you drive more SEO growth for your brand.
Thanks & Acknowledgements
Reboot Data Team
Our in-house data scientists went to great lengths to develop a robust methodology for us to test our hypothesis, before proceeding to write and run the required scripts to collect all the data that we needed. Next, they analysed the raw data to identify any correlations and provided invaluable levels of expertise so our team could interpret the data to draw our conclusions. We are lucky to have such qualified and experienced experts as part of our SEO agency.
Reboot Graphics Team
Our graphics team was also instrumental in pulling together this study, helping us turn our raw data into a digestible format and a shareable PDF deck (which you can download here).
Dan Hinckley at Go Fish Digital
Dan over at Go Fish Digital put together a fantastic piece about using compression ratios to identify low-quality content.
While our study did not find any correlation between compression ratios and SEO rankings, we were testing a slightly different theory than the one Dan's content focuses on, which is itself related to a different study which suggested that pages with a compression ratio of greater than 4.0 were more likely to be spam).
Still, our team took great influence from the Python code put forward by Dan and the Go Fish team, so we wanted to extend a thanks to them in this write up also.