
- SEO industry statistics
- What is the average cost of SEO services?
- SEO ROI statistics
- SEO marketing statistics
- Mobile SEO statistics
- SEO voice search statistics
- Video SEO statistics
- Technical SEO statistics
- Local SEO statistics
- Search engine statistics
- Keyword statistics
- AI SEO statistics
- Latest SEO trends 2026
- SEO statistics FAQs
- Sources
- Methodology
_____ SEO STATS
SEO statistics 2026
As of 2026, Google accounts for almost 90% of the global search engine market, equating to nearly 14 billion searches a day.
53% of website traffic comes from organic search, leading to an average close rate of 14.6%. In short, having a clear online presence is vital for brands to stand out from the crowd and rise above their competitors.
Businesses allocate 10–20% of their digital marketing to SEO. Given that the number one search result on Google gets around 27% of clicks, this has to be seen as money well spent by generating clicks and converting customers.
With this in mind, search marketing agency and GEO agency Reboot Online has collated an extensive SEO statistics report. This features the latest SEO facts and research for 2026, including the:
-
State of the SEO industry
-
Average cost for SEO services
-
SEO ROI statistics
-
Average SEO salary statistics in the UK
We’ve also analysed the latest SEO trends for 2026, including SEO marketing statistics, changes in search engine market share over time, and the impact of AI on SEO.
Top 10 must-know SEO facts for 2026
The SEO industry market size is estimated at $83.9 billion as of 2026. [SharkPlatform via ACCESS Newswire Inc.]
The average SEO salary in the UK is around £39,719, with London typically the best paid location at £48,026. [Reboot Online]
The average cost of SEO ranges from £4,000 to £8,200, depending on the services you require. [Reboot Online]
‘SEO company’ was the most-searched SEO term in 2025, with a Google Trends index score of 56. [Google Trends]
Search interest for ‘AI SEO’ increased by 3,300% between 2020 and 2025. [Reboot Online]
SEO Subreddits have a favourable view towards SEO with a mean average score between 0.1 and 0.2. [Reboot Online]
49% of business owners believe that SEO is their most effective digital marketing strategy. [Website Builder Expert]
Two-thirds of marketers believe SEO link building has a big impact on search engine rankings. [uSERP]
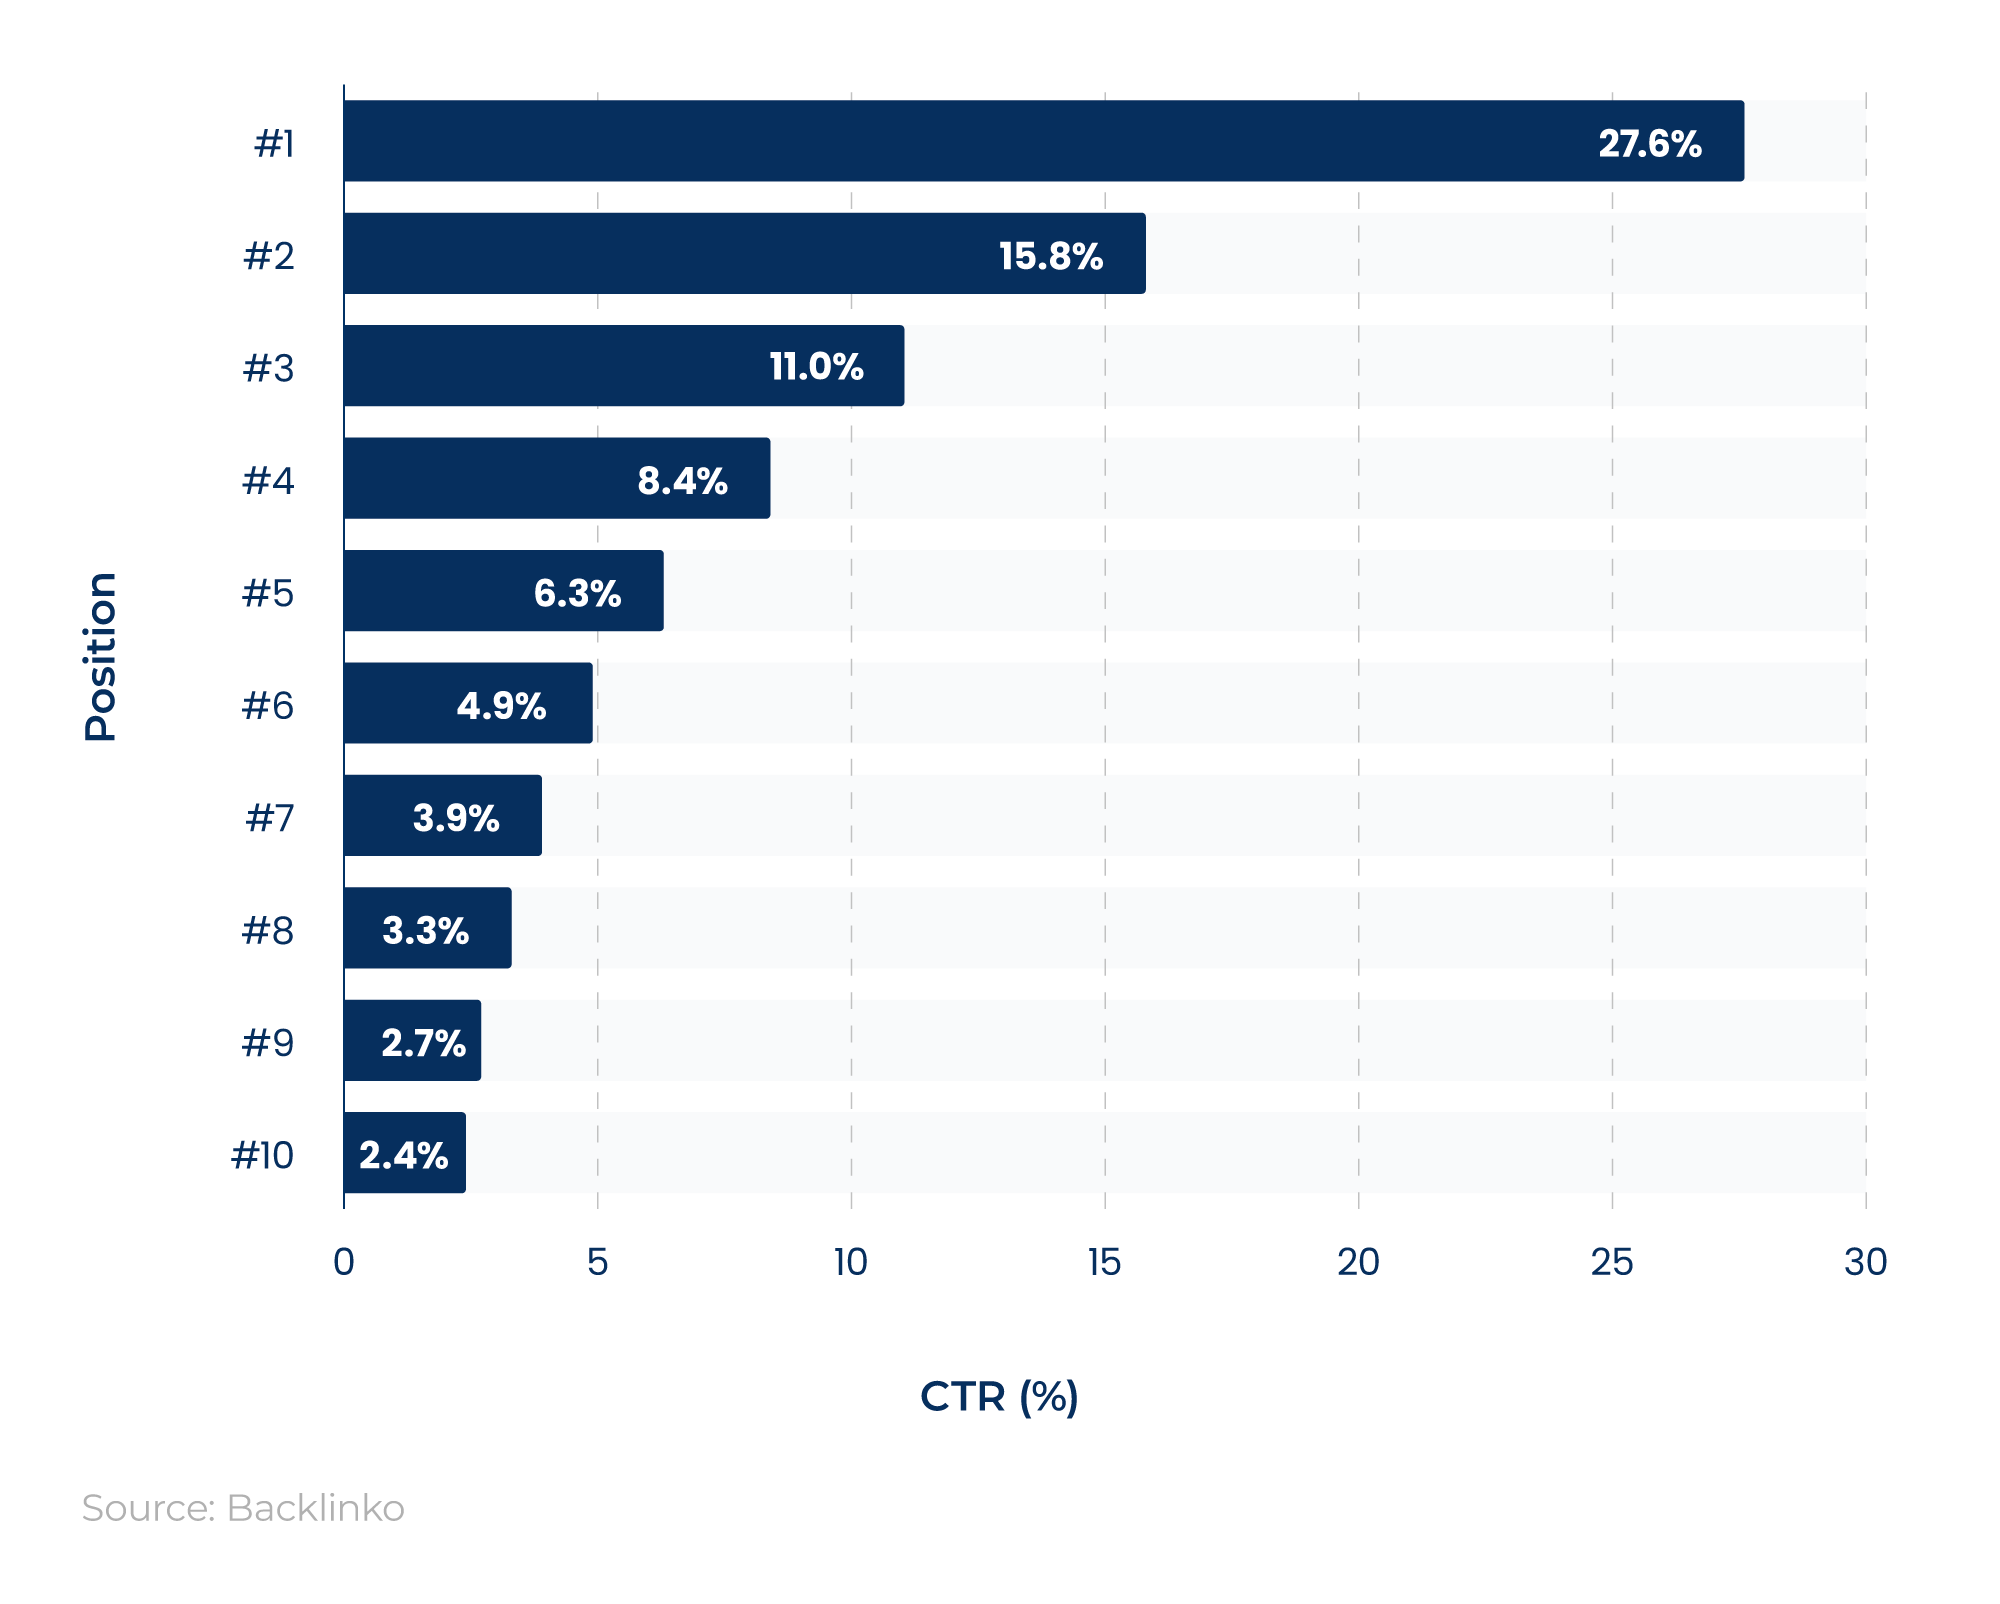
The average CTR for the number one position in Google is 27.6%. [Backlinko]
53% of web traffic comes from organic search. [SharkPlatform]
SEO industry statistics
SEO market size statistics
The SEO market size for 2026 is $83.9 billion. This represents a 39.8% increase over the previous six years.
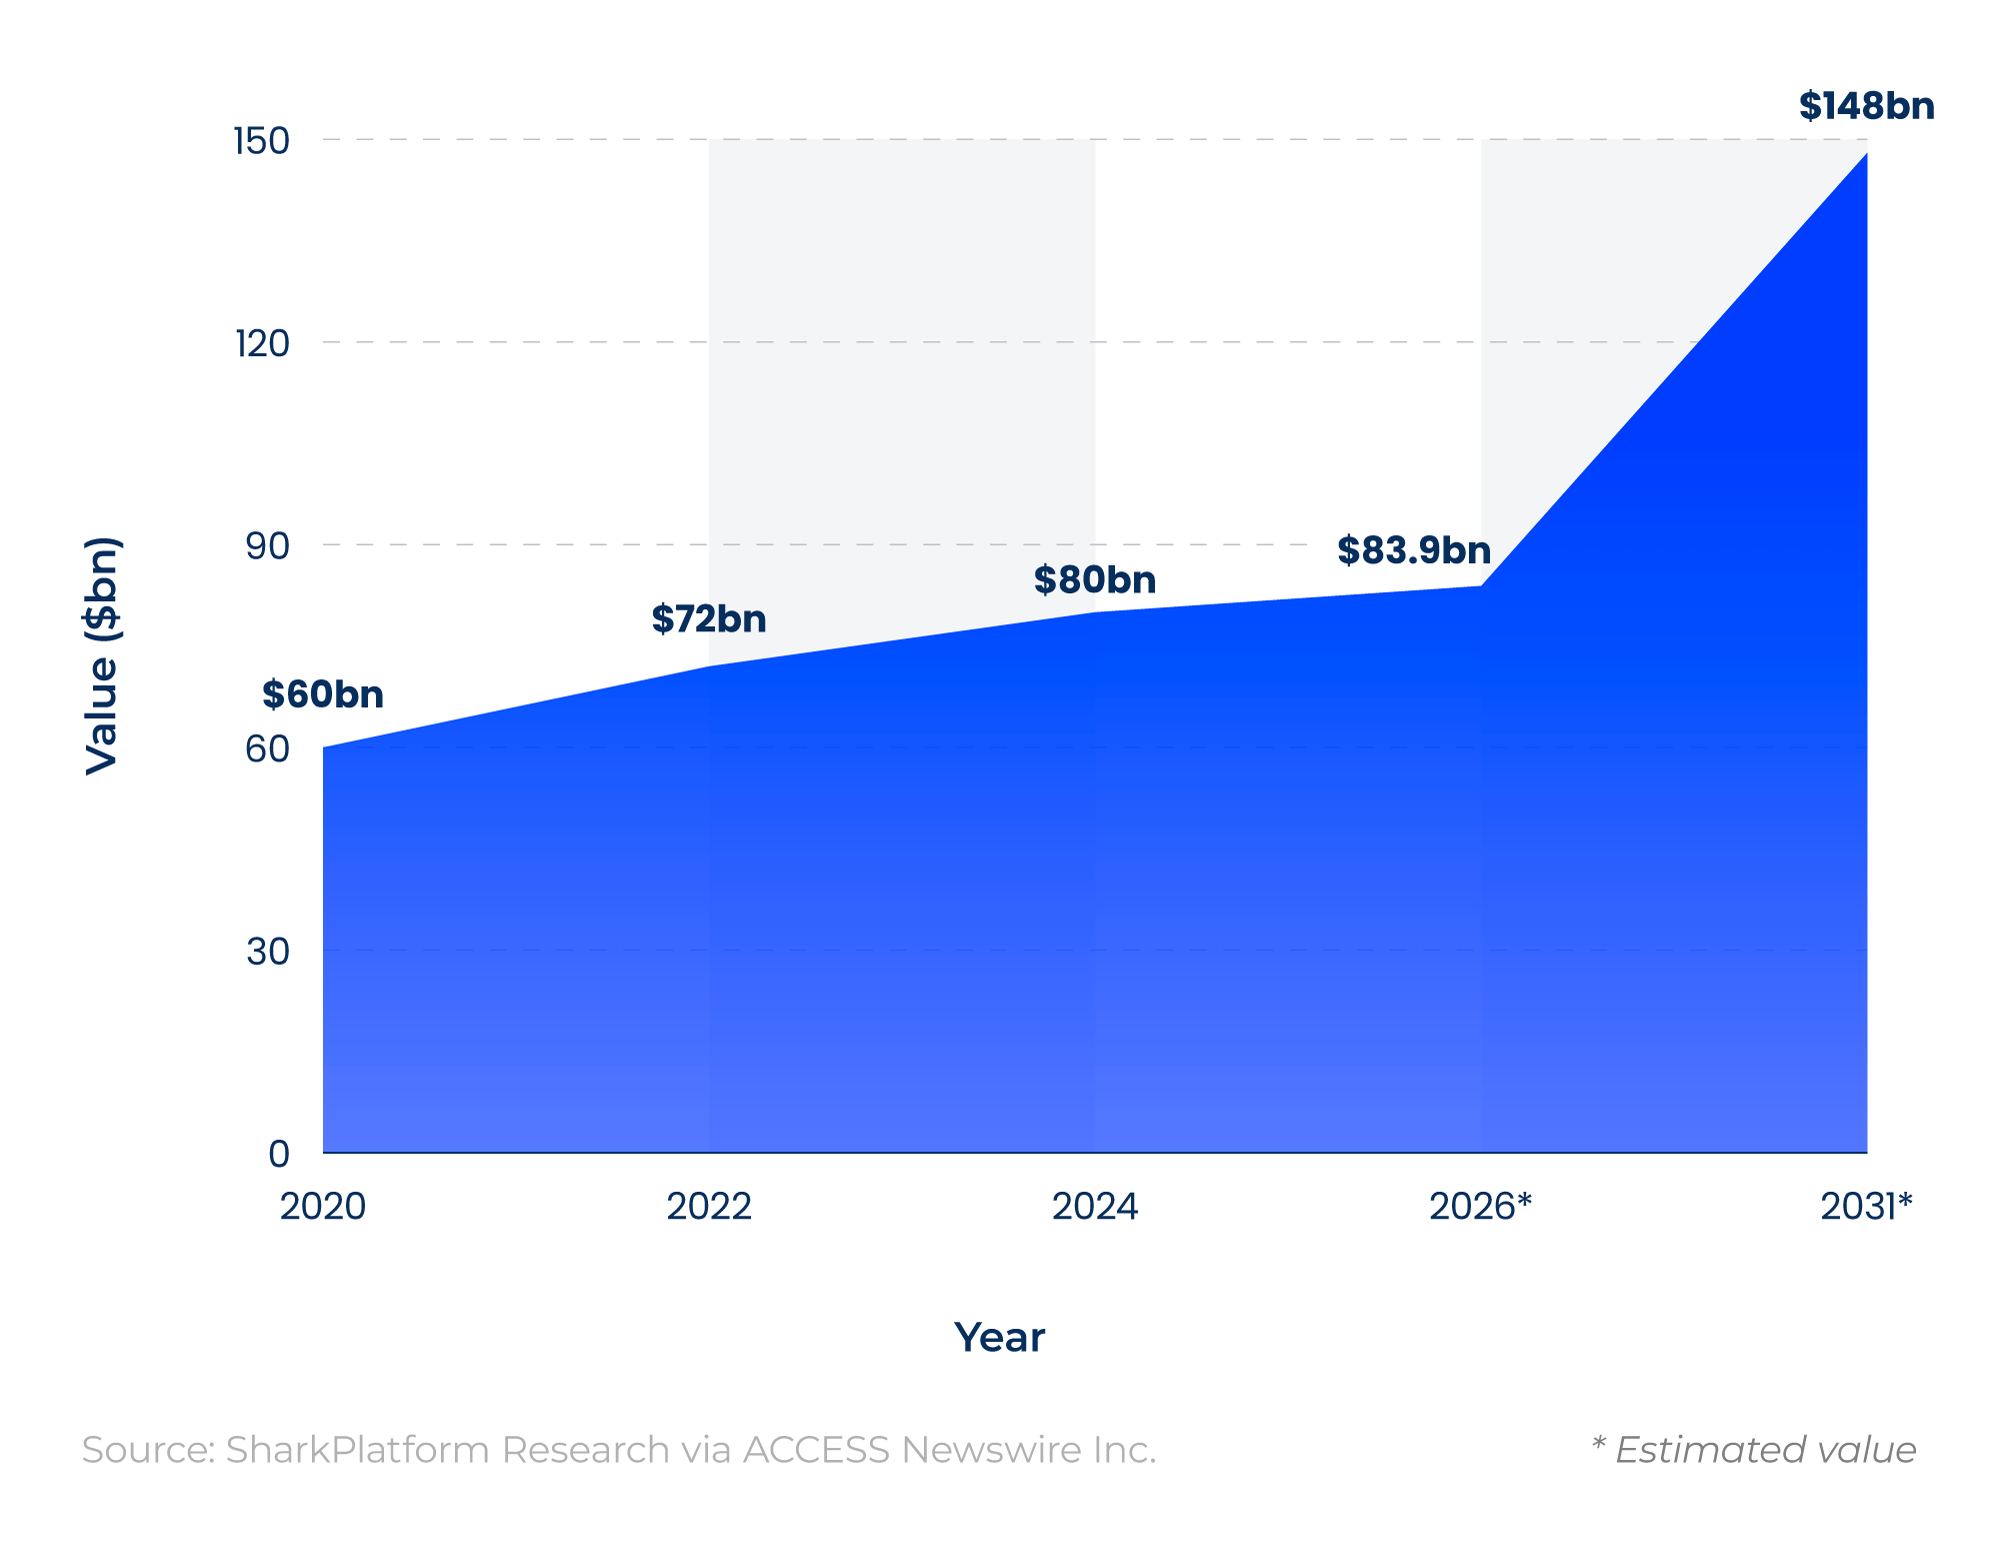
SEO market forecasts suggest the industry could be worth around $148 billion by 2031 (a 76.4% rise in five years).
SEO job market statistics
Our analysis of more than 8,000 job adverts between 2025 and 2026 shows that the median average SEO salary in the UK is approximately £39,719, rising to a mean average of £43,426.
Typically, those working in the SEO industry can expect earnings between £27,496 and £66,934. Yet this will depend on various factors, such as job role, location, age, experience, and whether the job is remote.
TABLE 1: SEO salary statistics in the UK for the most common SEO jobs
|
Job title |
Median salary (£) |
Mean salary (£) |
Min. salary (£) |
Max. salary (£) |
Job count |
Percentage of job count (%) |
|---|---|---|---|---|---|---|
|
Digital marketing executive |
£30,551 |
£31,198 |
£23,169 |
£73,247 |
1,643 |
19.76% |
|
SEO engineer |
£45,232 |
£47,772 |
£25,747 |
£107,953 |
1,352 |
16.26% |
|
SEO manager |
£39,583 |
£42,931 |
£24,088 |
£121,232 |
1,055 |
12.69% |
|
SEO assistant |
£26,333 |
£26,967 |
£23,049 |
£40,347 |
819 |
9.85% |
|
SEO specialist |
£46,379 |
£47,638 |
£27,496 |
£163,482 |
607 |
7.30% |
|
Digital marketing specialist |
£35,927 |
£41,215 |
£27,930 |
£71,910 |
368 |
4.43% |
|
Growth SEO lead |
£51,078 |
£50,187 |
£23,062 |
£84,775 |
323 |
3.89% |
|
Digital designer |
£37,860 |
£38,455 |
£24,860 |
£59,619 |
281 |
3.38% |
|
SEO coordinator |
£28,842 |
£30,876 |
£22,590 |
£70,254 |
224 |
2.69% |
|
SEO consultant |
£43,630 |
£48,247 |
£24,416 |
£157,790 |
194 |
2.33% |
Source: Data collected by Reboot Online via internal data sources
Our research shows that digital marketing executive roles were the most common in the SEO industry between 2025 and 2026, accounting for almost one in five job listings.
On average, a digital marketing executive in the UK can expect to earn £30,551 (median) and £31,198 (mean) a year, with a salary ranging from £23,169 to £73,247.
This is followed by an SEO engineer, who appears in about one in six job adverts in the UK.
With a median salary of £45,232 and a mean salary of £47,772, an SEO engineer can expect to earn between £25,747 and £107,953 a year.
Did you know?
Demand for SEO specialists is forecasted to increase by 22% between 2020 and 2030.
Highest average SEO salary in the UK by job title
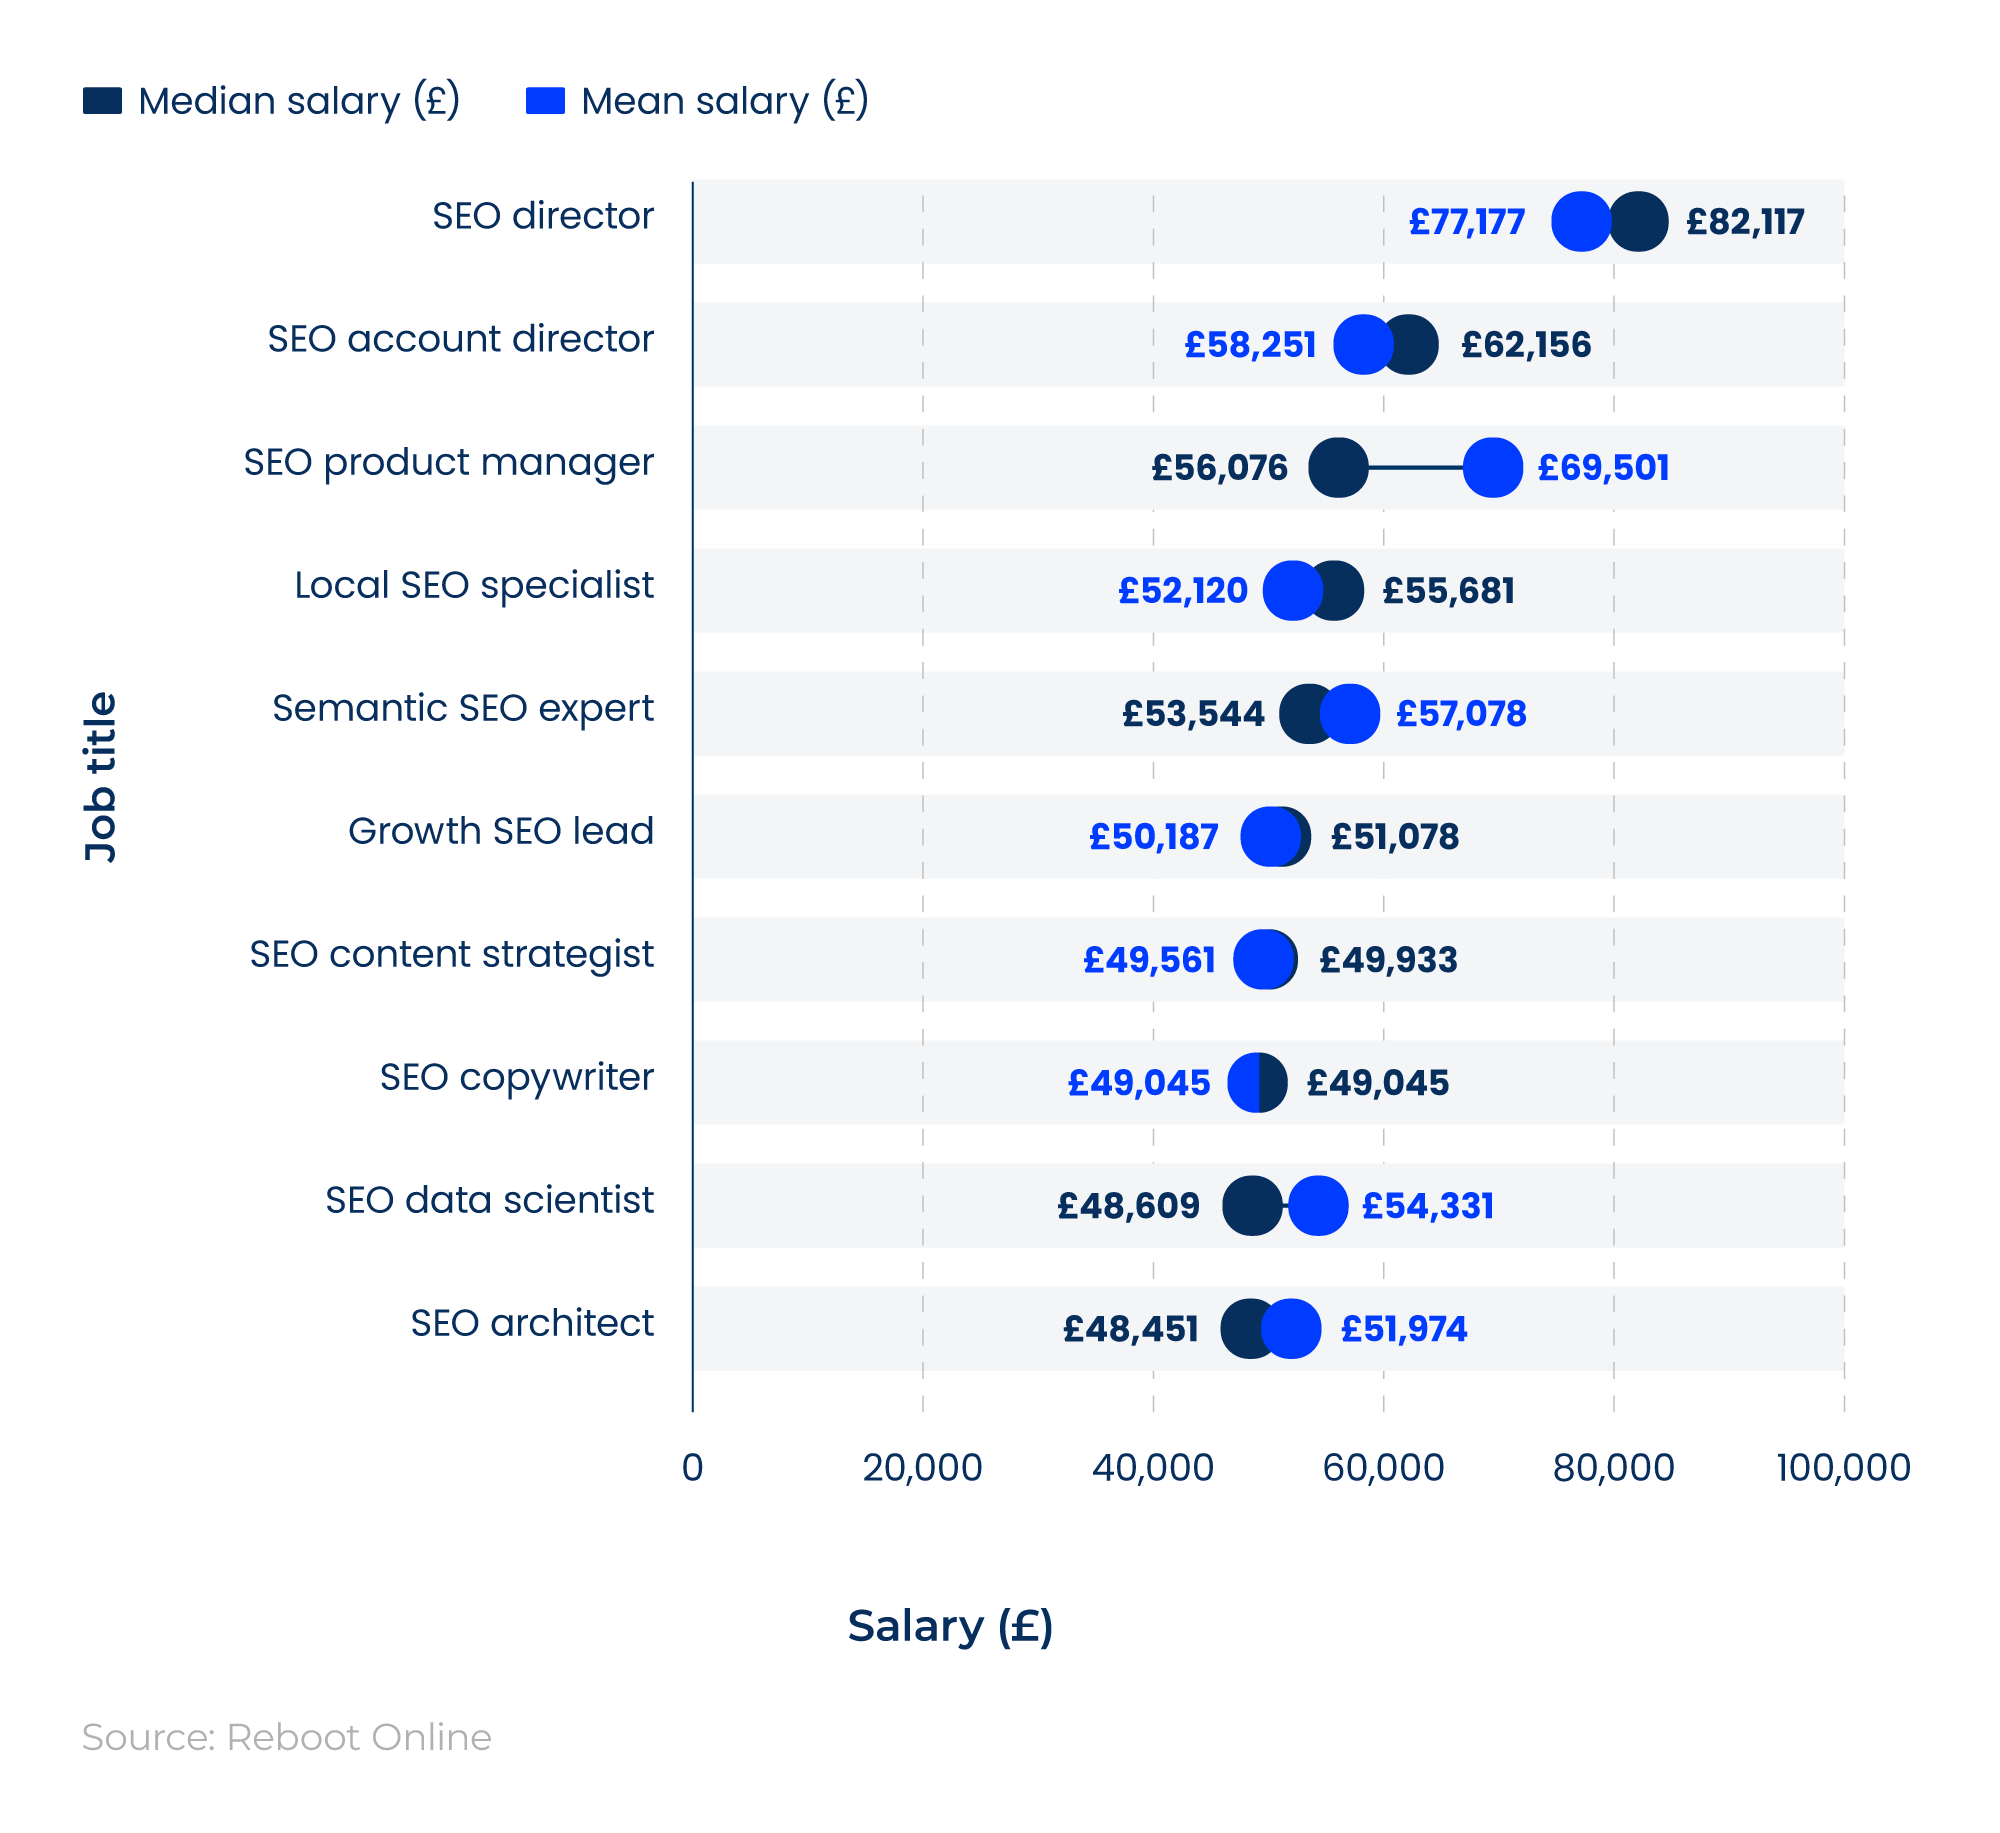
SEO directors typically earn the most in the SEO industry, with a median salary of £82,117 and a mean salary of £77,177.
This is up to a third more than the next-highest-paid job (SEO account director), which typically earns £58,251 (mean) and £62,156 (median).
Highest maximum SEO salaries in the UK by job title
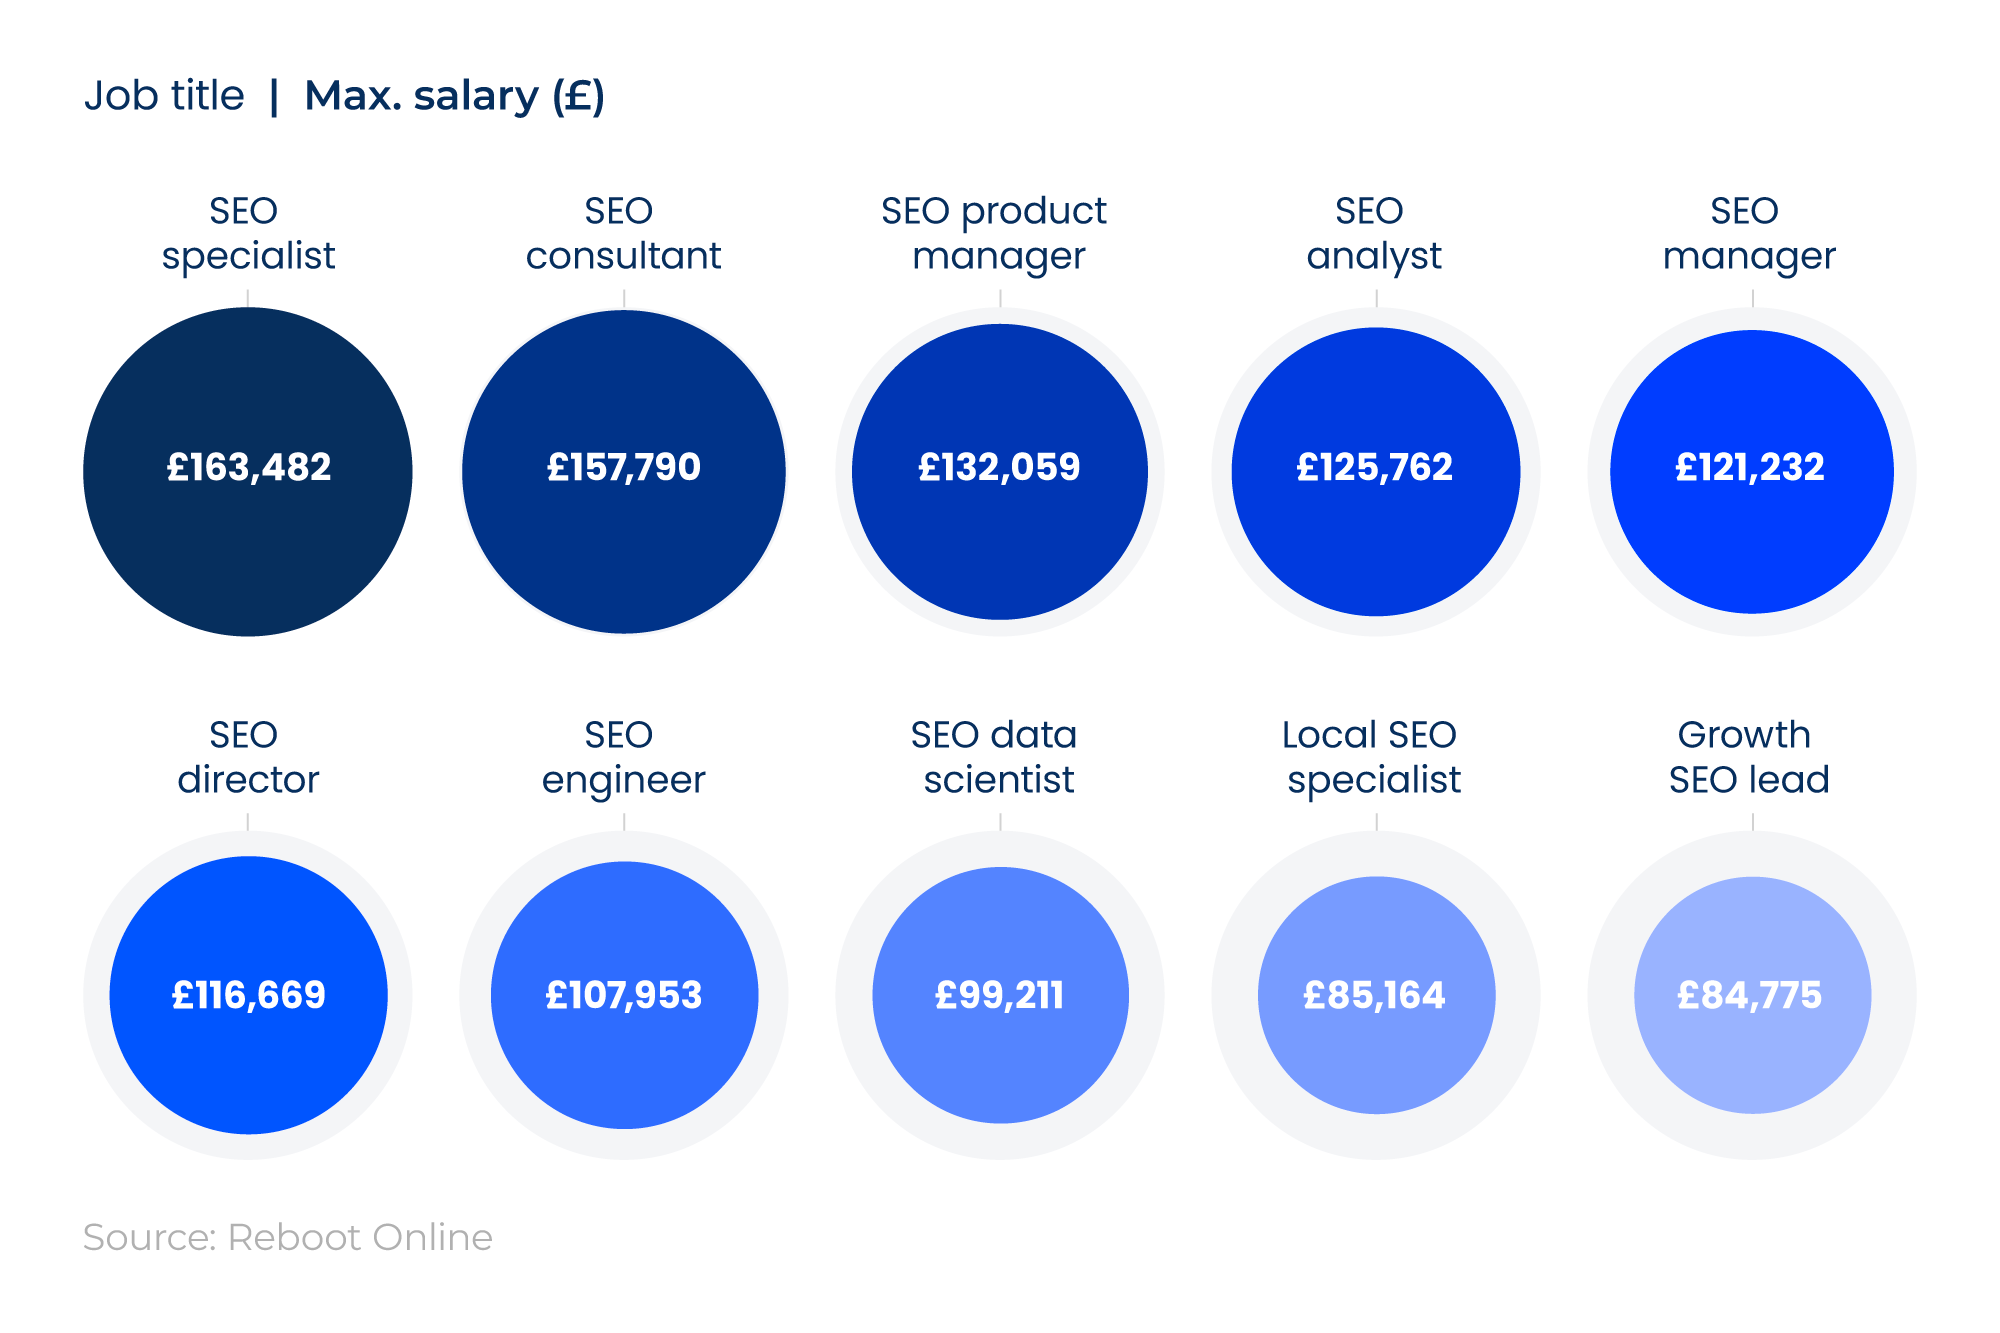
As of 2025–26, an SEO specialist could earn up to £163,482 in the UK. This is around 3.6% more than the typical SEO consultant, the next highest maximum earner in the SEO industry at £157,790.
TABLE 2: Most common locations in the UK for SEO jobs and their corresponding SEO salary statistics
|
City |
Median salary (£) |
Mean salary (£) |
Min. salary (£) |
Max. salary (£) |
Job count |
Percentage of job count (%) |
|---|---|---|---|---|---|---|
|
London |
£48,026 |
£50,774 |
£23,680 |
£132,059 |
1,379 |
26.28% |
|
Manchester |
£42,867 |
£41,134 |
£25,179 |
£123,166 |
394 |
7.51% |
|
Birmingham |
£44,503 |
£44,740 |
£25,235 |
£157,790 |
380 |
7.24% |
|
Salford |
£45,607 |
£45,409 |
£43,747 |
£48,220 |
166 |
3.16% |
|
Leeds |
£39,013 |
£42,103 |
£23,755 |
£122,948 |
163 |
3.11% |
|
Bristol |
£41,899 |
£43,858 |
£26,341 |
£73,977 |
118 |
2.25% |
|
Liverpool |
£32,092 |
£36,141 |
£24,350 |
£52,069 |
118 |
2.25% |
|
Edinburgh |
£45,114 |
£50,638 |
£26,226 |
£107,253 |
108 |
2.06% |
|
Sheffield |
£33,984 |
£38,682 |
£28,757 |
£85,684 |
106 |
2.02% |
|
Reading |
£40,519 |
£43,896 |
£26,337 |
£121,232 |
100 |
1.91% |
Source: Data collected by Reboot Online via internal data sources
More than a quarter of the SEO job adverts analysed between 2025 and 2026 were for roles based in London, the most of any UK city.
Those working in the capital’s SEO industry can expect to earn between £23,680 and £132,059 a year, with the median average sitting at £48,026 and the mean average at £50,774.
TABLE 3: Highest average SEO salary in the UK by location
|
City |
Median salary (£) |
Mean salary (£) |
|---|---|---|
|
Stevenage |
£56,796 |
£60,919 |
|
Gateshead |
£54,689 |
£54,689 |
|
London |
£48,026 |
£50,774 |
|
Bridgwater |
£47,906 |
£47,224 |
|
Plymouth |
£47,232 |
£46,877 |
|
Coventry |
£46,505 |
£42,618 |
|
Gerrards Cross |
£45,974 |
£45,996 |
|
Bradford |
£45,876 |
£41,524 |
|
Salford |
£45,607 |
£45,409 |
|
Cardiff |
£45,576 |
£50,451 |
Source: Data collected by Reboot Online via internal data sources
The highest average SEO salary in the UK in 2025–26 is in Stevenage, with a typical median salary of £56,796 and a mean salary of £60,919.
This is up to 11.4% higher than in Gateshead, the next-highest-earning city on average for SEO jobs.
Highest maximum SEO salaries in the UK by location
SEO salary statistics show that Swansea has the highest maximum SEO salary in 2025–26.
TABLE 4: Top 10 UK cities for highest maximum SEO salaries
|
City |
Max. salary (£) |
|---|---|
|
Swansea |
£163,482 |
|
Birmingham |
£157,790 |
|
Portsmouth |
£136,219 |
|
London |
£132,059 |
|
Manchester |
£123,166 |
|
Leeds |
£122,948 |
|
Reading |
£121,232 |
|
Bath |
£119,278 |
|
Cambridge |
£107,953 |
|
Edinburgh |
£107,253 |
Source: Data collected by Reboot Online via internal data sources
At £163,482, this is around 3.6% more than in Birmingham and 20% more than the average SEO job in Portsmouth.
TABLE 5: SEO salaries statistics in the UK by work type (non-remote vs remote)
|
Work type |
Median salary (£) |
Mean salary (£) |
Min. salary (£) |
Max. salary (£) |
Job count |
|---|---|---|---|---|---|
|
Non-remote |
£38,294 |
£40,958 |
£23,049 |
£163,482 |
6,589 |
|
Remote |
£39,721 |
£40,405 |
£22,316 |
£132,059 |
1,729 |
Source: Data collected by Reboot Online via internal data sources
Those working in non-remote SEO jobs can usually expect to earn more than those working remotely.
Of the 8,318 SEO job adverts analysed between 2025–26, almost 80% were for non-remote positions. This yielded salary ranges of £23,049 to £163,482 for non-remote jobs, versus £22,316 to £132,059 for remote positions.
The mean average salary for a non-remote SEO job is £40,958, compared to £40,405 for remote listings. That said, the median average for remote SEO roles is marginally higher (£39,721 vs £38,294).
What is the average cost of SEO services?
According to our internal data, the average SEO cost in 2025 was just over £6,820 per client.
Average SEO cost by service
The average price of SEO varies depending on the type of service required.
For example, the average cost of SEO consultancy services provided by Reboot Online in 2025 was £4,010. This was almost half the typical spend for digital PR.
Average cost of SEO in the UK by service
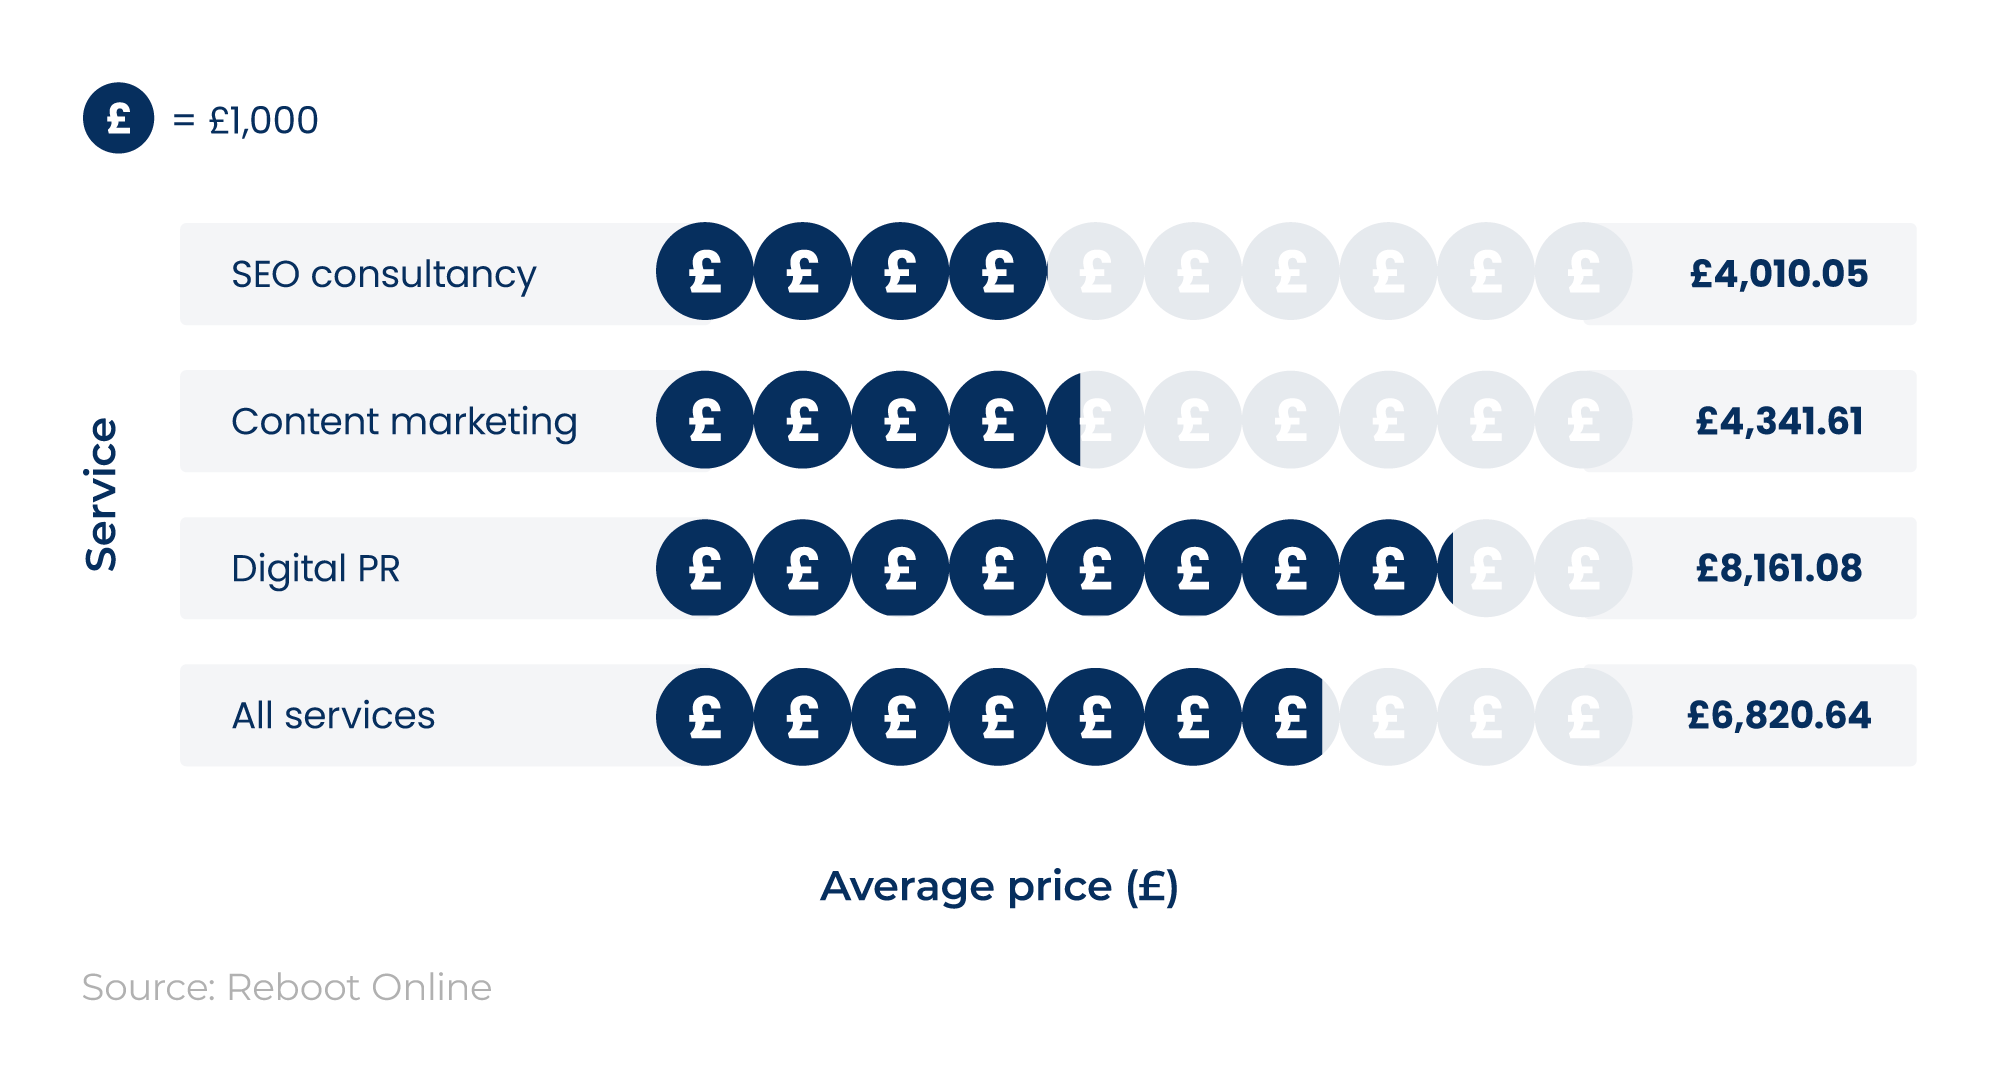
Clients of Reboot Online spent an approximate average of £4,341 on content marketing in 2025, almost 8.3% more than on SEO consultancy.
TABLE 6: Average price for SEO services in the US
|
Package |
Average cost ($) |
|---|---|
|
Ongoing monthly SEO |
$1,500 to $5,000 per month |
|
One-time SEO project |
$5,000 to $30,000 per project |
|
Fixed contract |
$1,500 to $25,000 per year |
|
Hourly SEO consulting |
$100 to $300 per hour |
|
SEO copywriting |
$0.15 to $0.50 per word |
|
Link profile audit |
$500 to $7,500 per audit |
|
SEO content audit |
$500 to $7,500 per audit |
Source: Data from Nutshell’s SEO Pricing: What’s the Cost of SEO?, SEO service pricing broken down by pricing model
SEO research by Nutshell concluded that the average price for SEO services in the US ranges from $0.15 to $0.50 per word for SEO copywriting, up to $30,000 for a one-time SEO project.
Average SEO cost for a small business
Small businesses typically spend between $1,500 and $3,000 per month on SEO services.
TABLE 7: Average SEO costs by business size
|
Business size |
SEO pricing ($) |
|---|---|
|
Startup |
$750 to $1,500 per month |
|
Small business |
$1,500 to $3,000 per month |
|
Medium-sized business |
$1,500 to $5,000 per month |
|
Enterprise |
$5,000+ per month |
Source: Data from Nutshell’s SEO Pricing: What’s the Cost of SEO?, SEO costs broken down by business size
The average price for SEO services usually increases with business size, ranging from $750 to $1,500 per month for startups to more than $5,000 per month for enterprises.
Average SEO budget statistics
SEO stats from Backlinko suggest that the average SEO budget for a small US business is just under $500 a month.
An Ahrefs study found that US SEO agencies typically charge around $3,200 per month for SEO services, compared to $3,250 for consultancies and almost $1,350 for freelancers.
TABLE 8: How marketers plan to increase their marketing investment, 2026
|
Investment |
Percentage of respondents (%) |
|---|---|
|
AI chatbots (e.g., ChatGPT, Perplexity, Gemini, Claude) |
37.7% |
|
Paid social media |
37.4% |
|
Video marketing |
37.1% |
|
Content marketing |
36.9% |
|
Website/blog/SEO |
35.4% |
Source: Data from HubSpot’s 2026 State of Marketing report, 7. Marketing budgets are up modestly in 2026
35.4% of marketers surveyed by HubSpot plan to increase their SEO investment in 2026.
By contrast, 37.7% said they would spend more on AI chatbots, with a similar percentage (37.4%) opting to invest further in paid social media.
Did you know?
More than 80% of companies surveyed by Databox use paid SEO tools, while 17% use only free tools.
SEO ROI statistics
SEO stats from ACCESS Newswire Inc. suggest that SEO campaigns can generate more than 700% ROI in some industries.
Average ROI statistics by different digital marketing methods
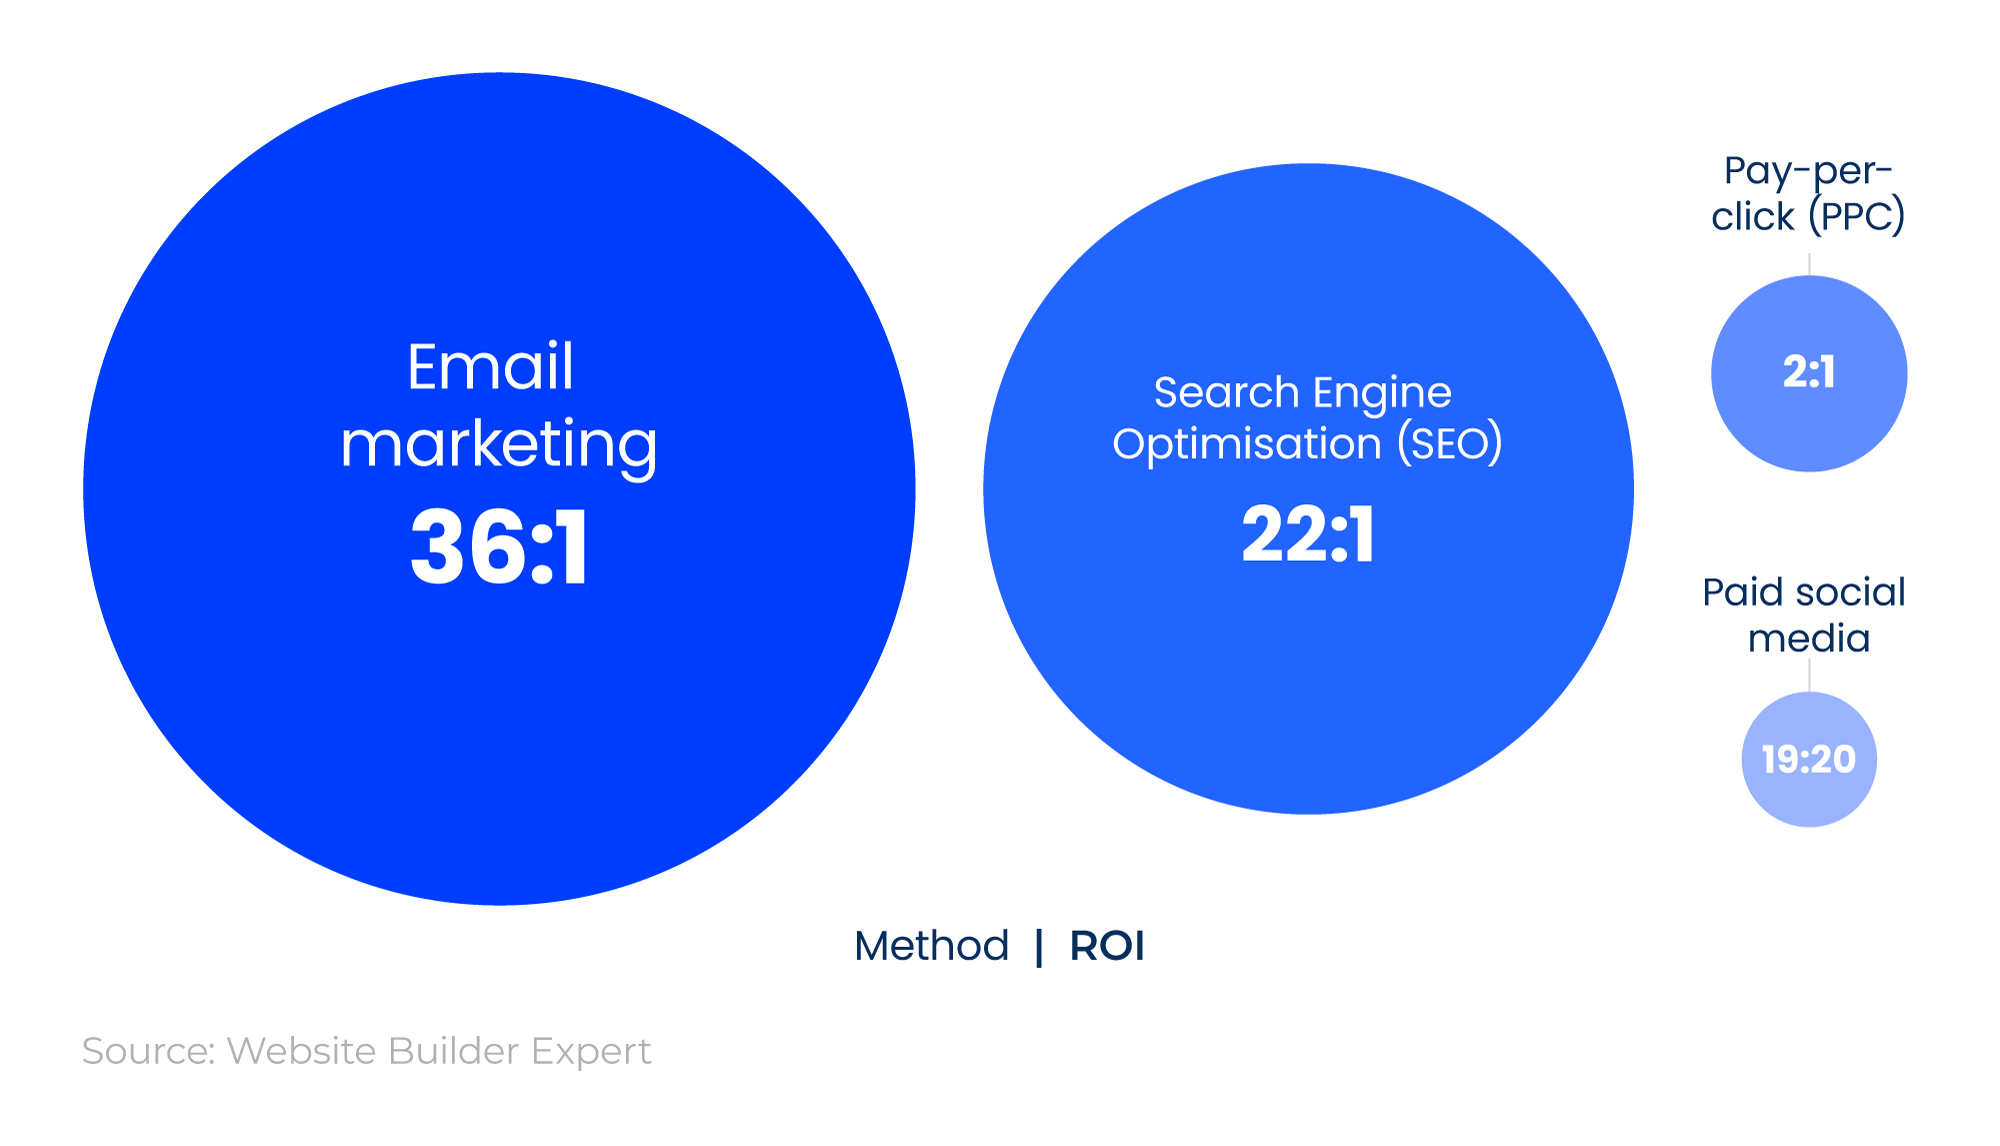
Research by Website Builder Expert shows that SEO marketing has an average ROI of 22:1 (+2,200%). This makes it the second-most-profitable digital marketing method, behind email marketing at 36:1 (+3,600%).
They found that:
-
Marketers who regularly calculate their ROI are 1.6 times more likely to see budget increases for their marketing activities.
-
An ROI of 5:1 (+500%) is considered an industry benchmark for effective digital marketing, with 10:1 (+1,000%) considered exceptional.
-
It takes an average of six to 12 months to see a significant improvement in ROI.
-
Technical SEO has an ROI of 117% (a higher return than content marketing at 16%, but lower than thought leadership marketing at 748%).
This is supported by Databox findings indicating that an SEO strategy typically takes about three months to mature and deliver results, with measurable improvements (e.g., increased traffic and leads) after six to 12 months.
Which digital marketing strategies offer the best ROI?
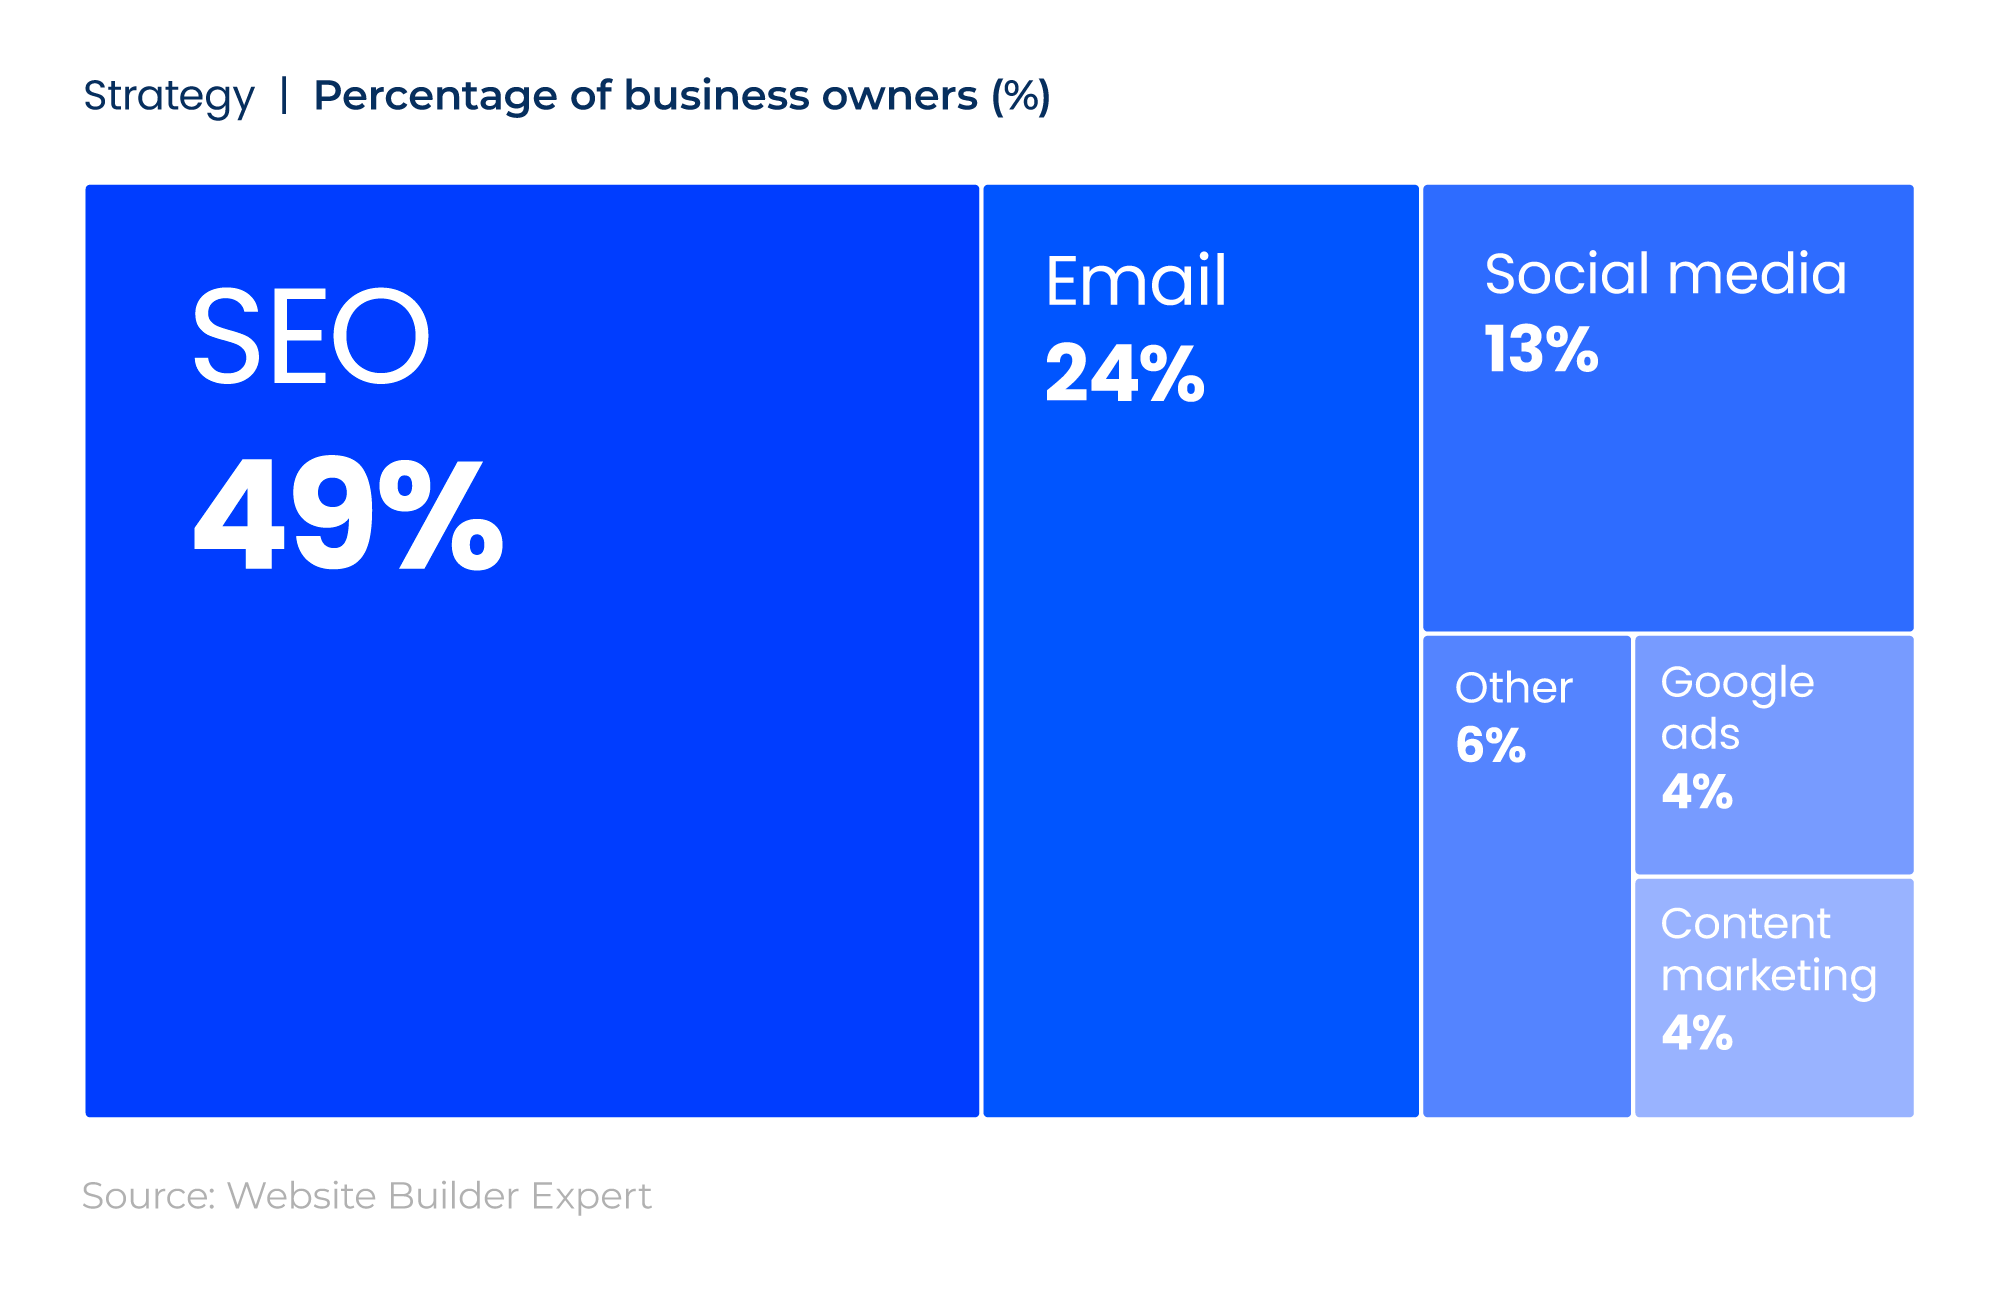
49% of the business owners surveyed by Website Builder Expert said that SEO was their most effective digital marketing strategy.
This was followed by 24% who felt email marketing provided the best return on their investment, and 13% who opted for social media as their best strategy.
SEO marketing statistics
According to HubSpot’s 2026 State of Marketing Report, 45% of marketers turn to websites, blogs, and SEO as their main marketing channel.
TABLE 9: Most-leveraged marketing channels
|
Marketing channel |
Percentage of respondents (%) |
|---|---|
|
Website/blog/SEO |
45% |
|
Organic social media content |
40% |
|
Email marketing |
40% |
|
Paid social media content |
39% |
|
Brand awareness |
36% |
Source: Data from HubSpot’s 2026 State of Marketing report, Graph: most-leveraged marketing channels
This is followed by 40% who mainly leverage organic social media content and email marketing.
B2B SEO statistics
30.2% of marketers surveyed by HubSpot say websites, blogs, and SEO deliver the best ROI across all marketing channels.
TABLE 10: Top B2B marketing channels by ROI
|
Marketing channel |
Percentage of respondents (%) |
|---|---|
|
Website/blog/SEO |
30.2% |
|
Email marketing |
23.6% |
|
Paid social media content |
23.3% |
Source: Data from HubSpot’s 2026 State of Marketing report, 1. Brands are recalibrating content for AI search
Yet, 23.6% claim that email marketing delivers the best return on investment, with a similar proportion (23.3%) opting for paid social media content.
SEO link building statistics
67.5% of those surveyed by uSERP believe that SEO link building (also known as hyper-relevancy link building) has a big impact on search engine rankings.
Impact of backlinks on search engine rankings
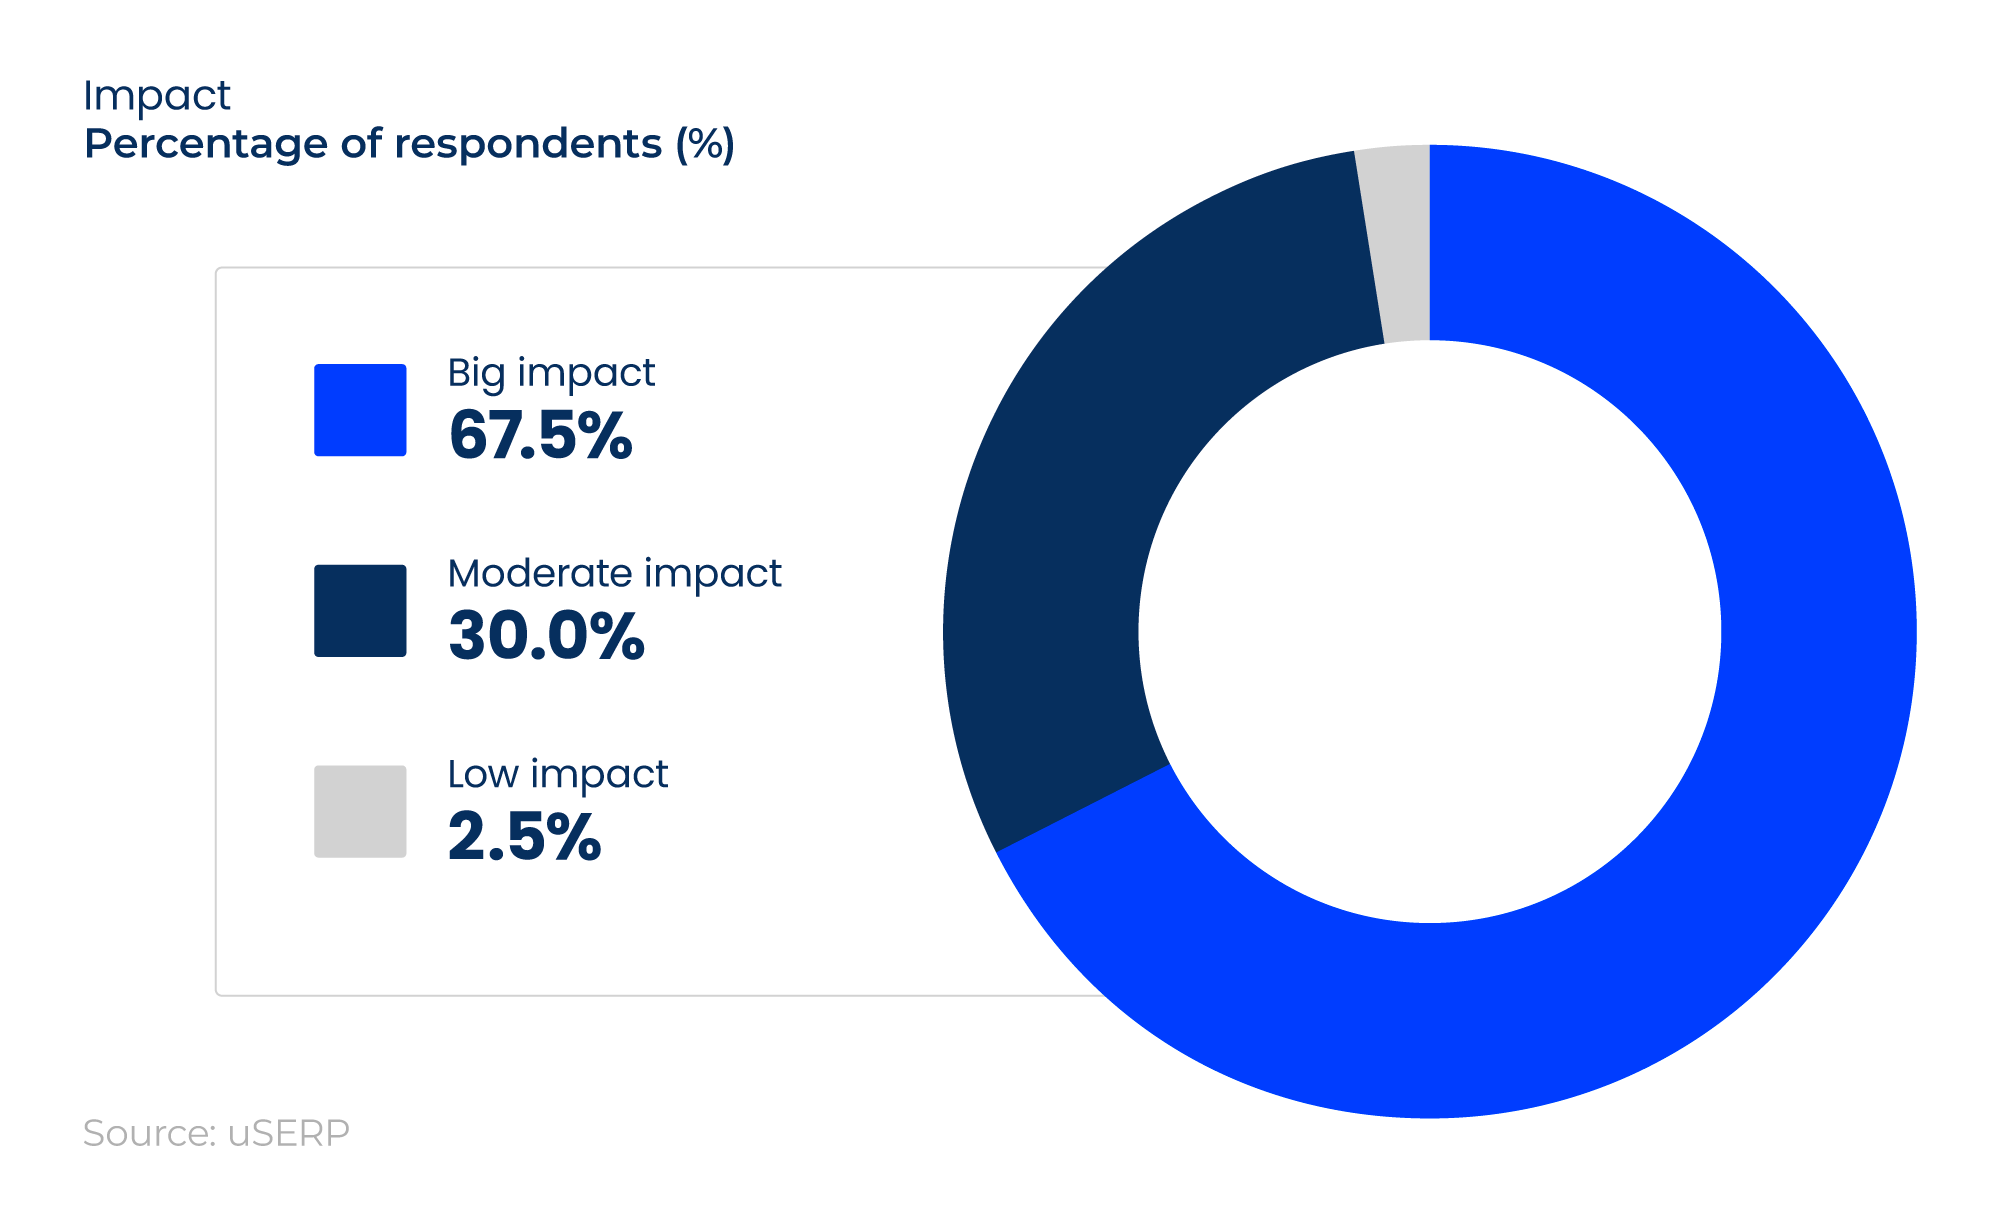
This is contrasted with 30% who think backlinks have a moderate impact on search engine performance, and just 2.5% who said it has a low impact.
Quality vs quantity: Which matters most for SEO link building?
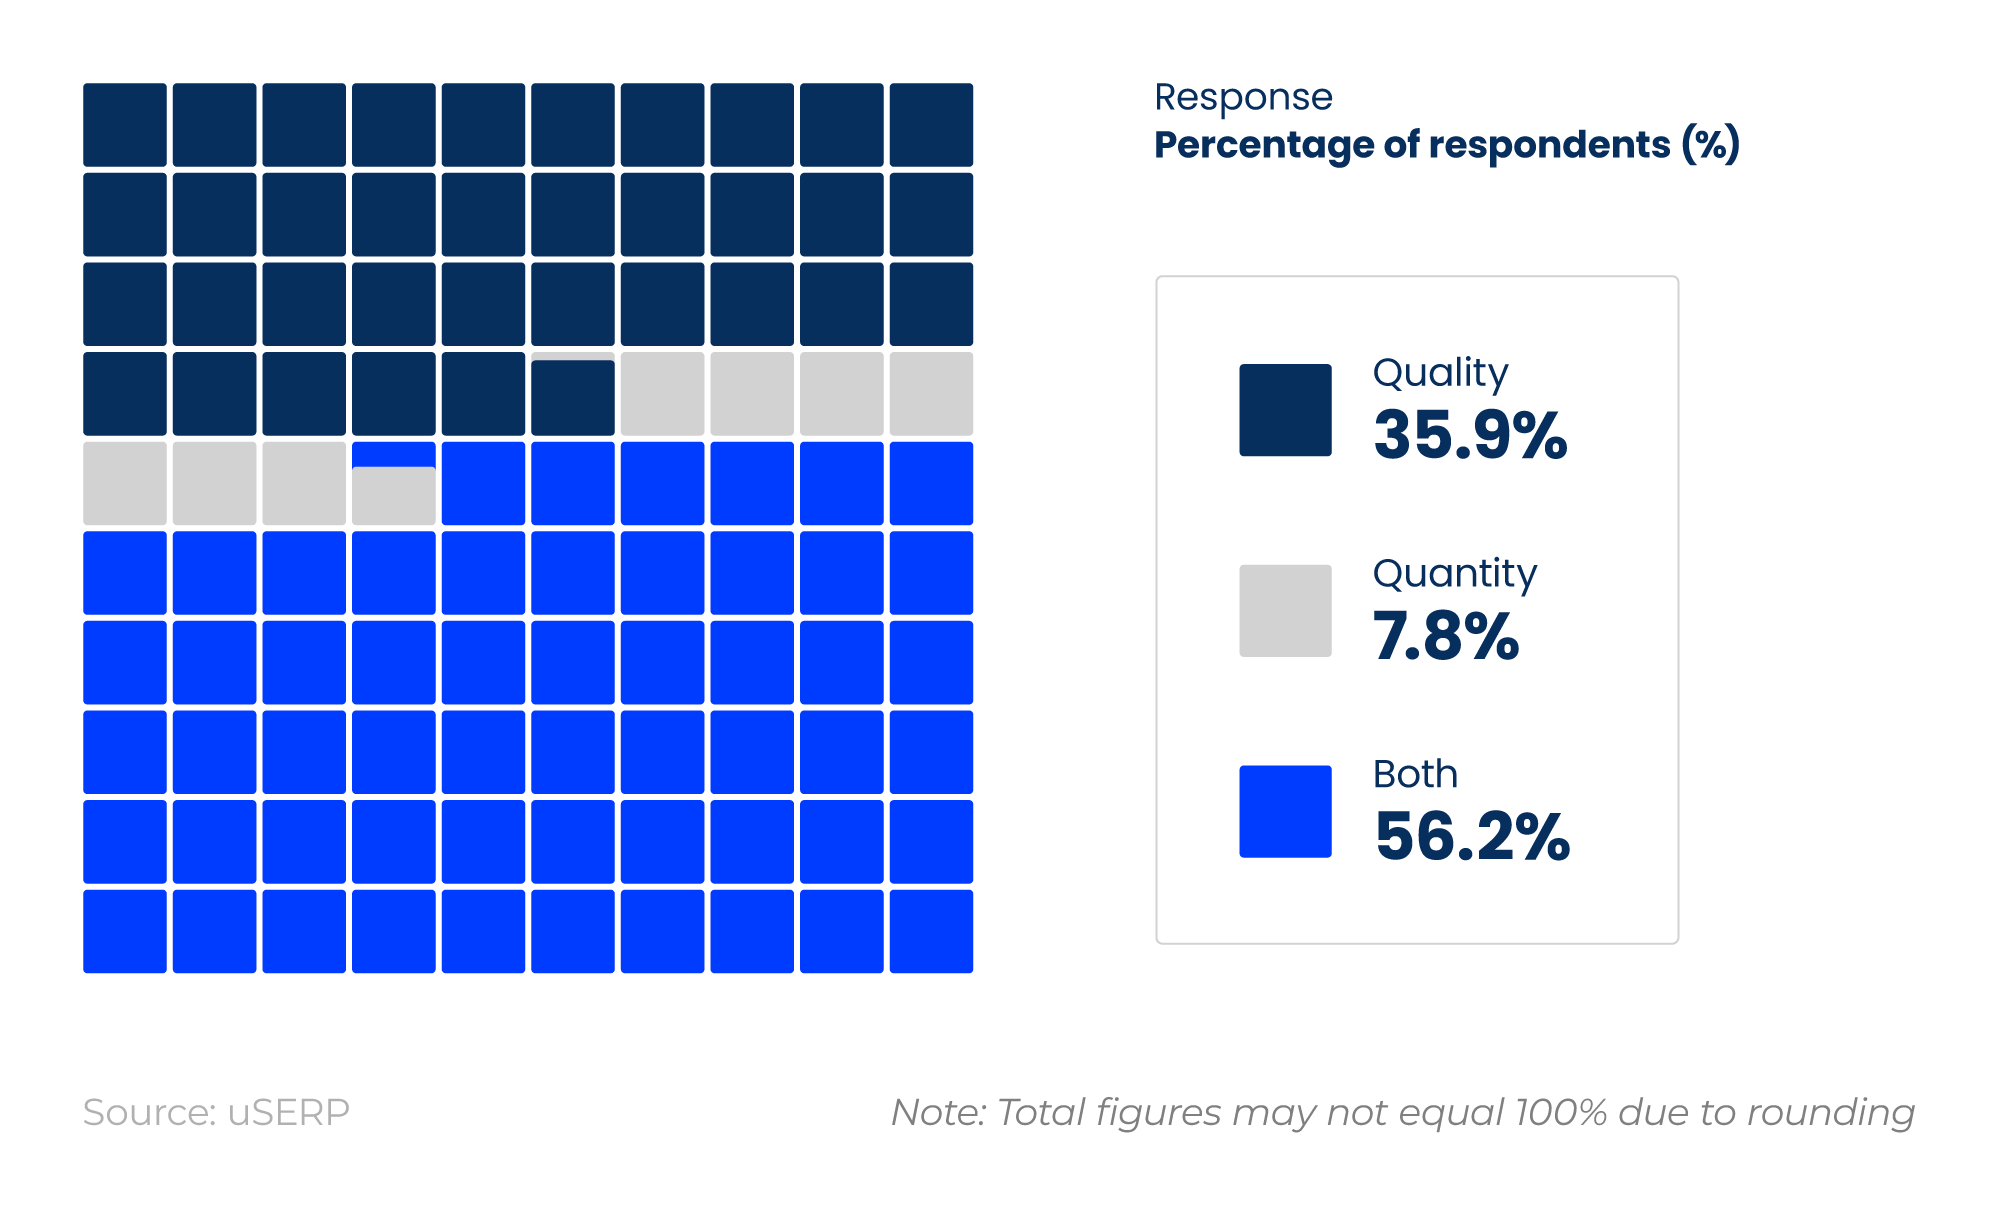
35.9% of people working in the SEO industry say the quality of links is the most important factor in SEO link building, compared to 7.8% who feel the quantity of backlinks matters more.
56.2% of those questioned by uSERP also felt that the quality and quantity of backlinks were equally important for SEO link building.
Contact us to explore how we can help your company improve its online visibility and long-term organic growth.
The importance of backlinks in an SEO strategy
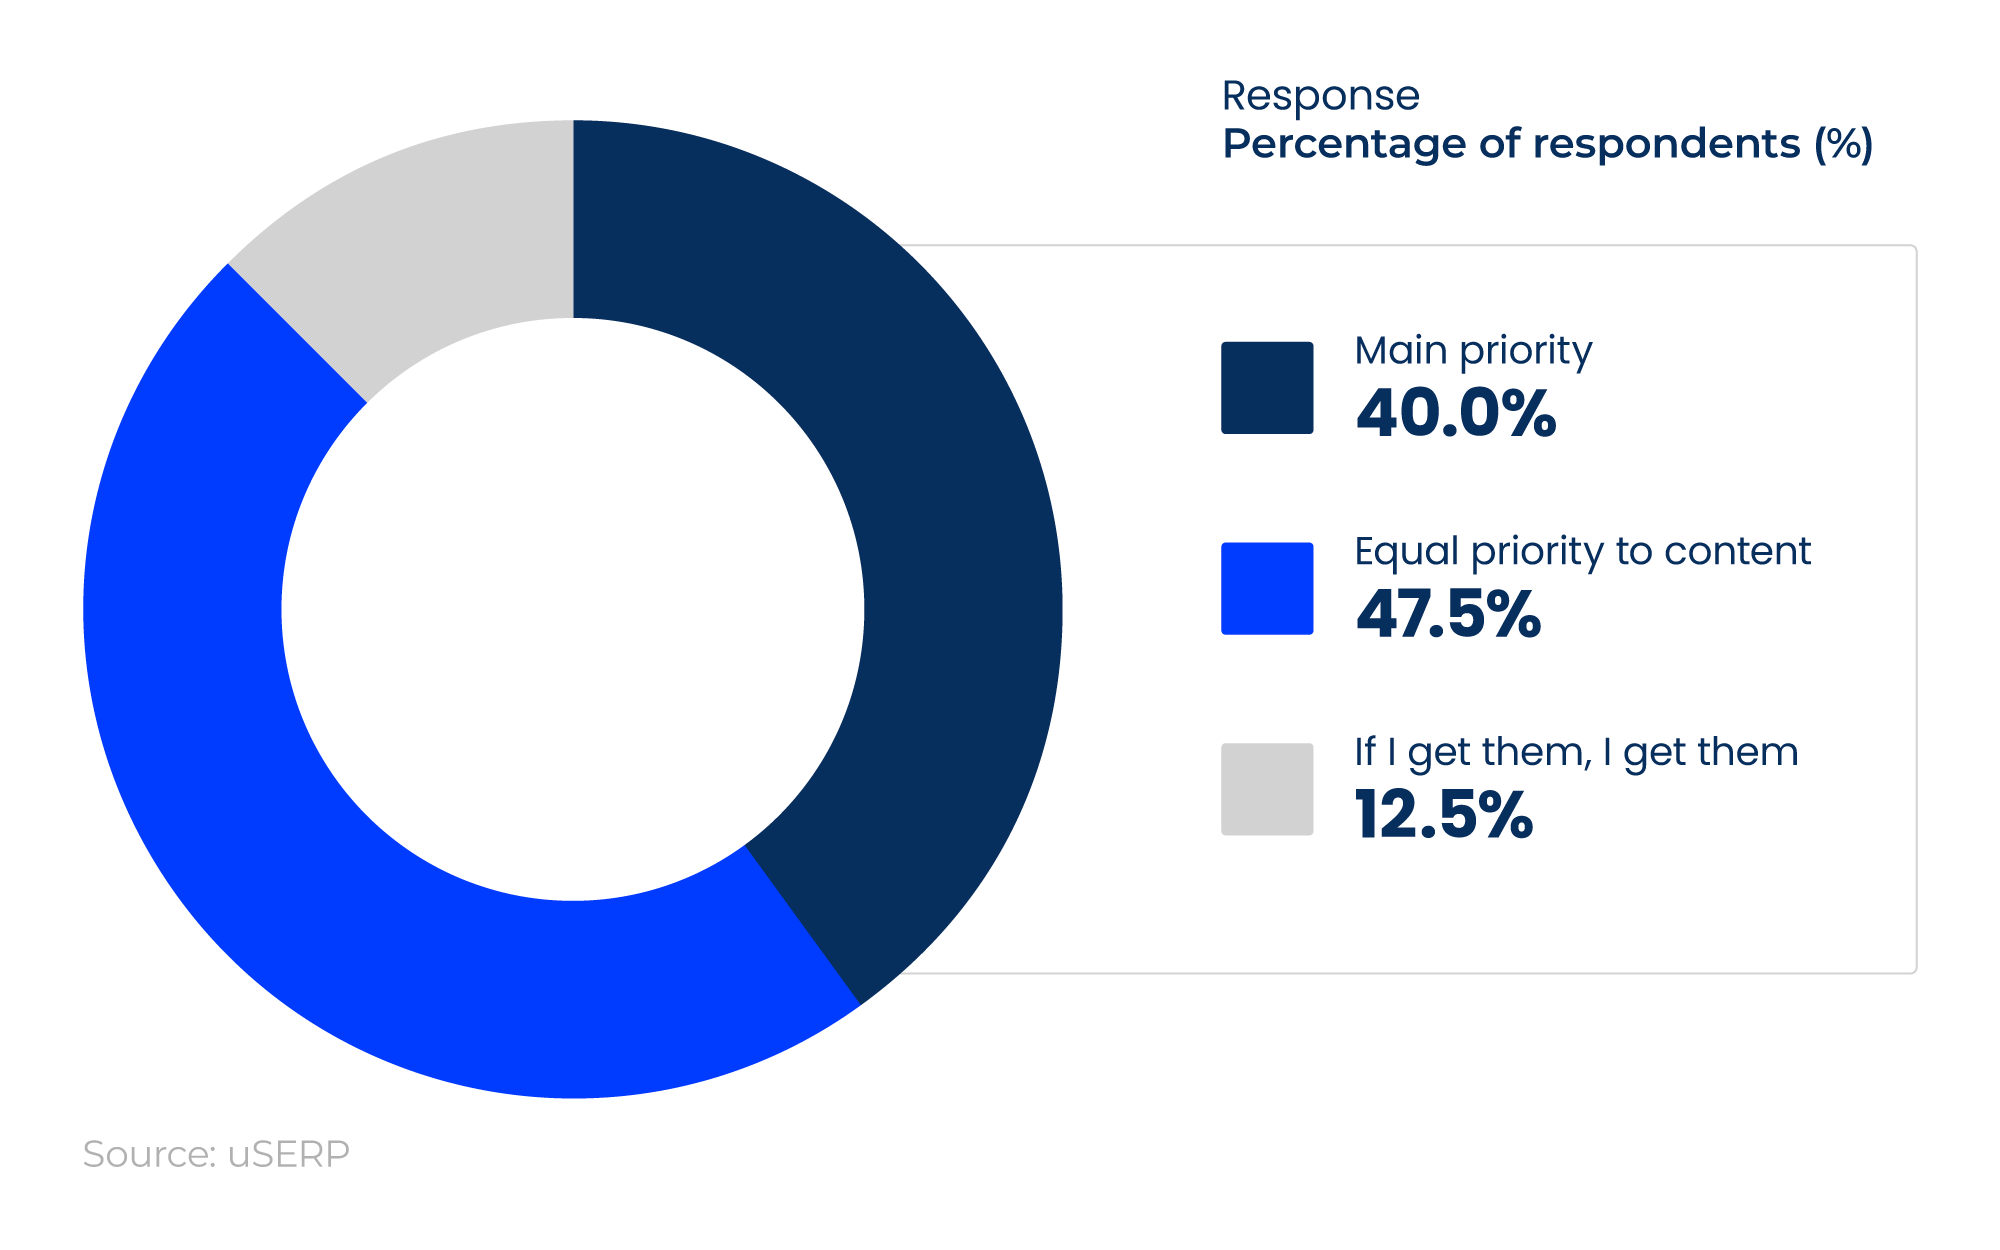
40% of SEO professionals place backlinks as their main priority when developing an SEO strategy, with 47.5% believing they’re just as important as content.
Impact of backlinks on future search engine rankings
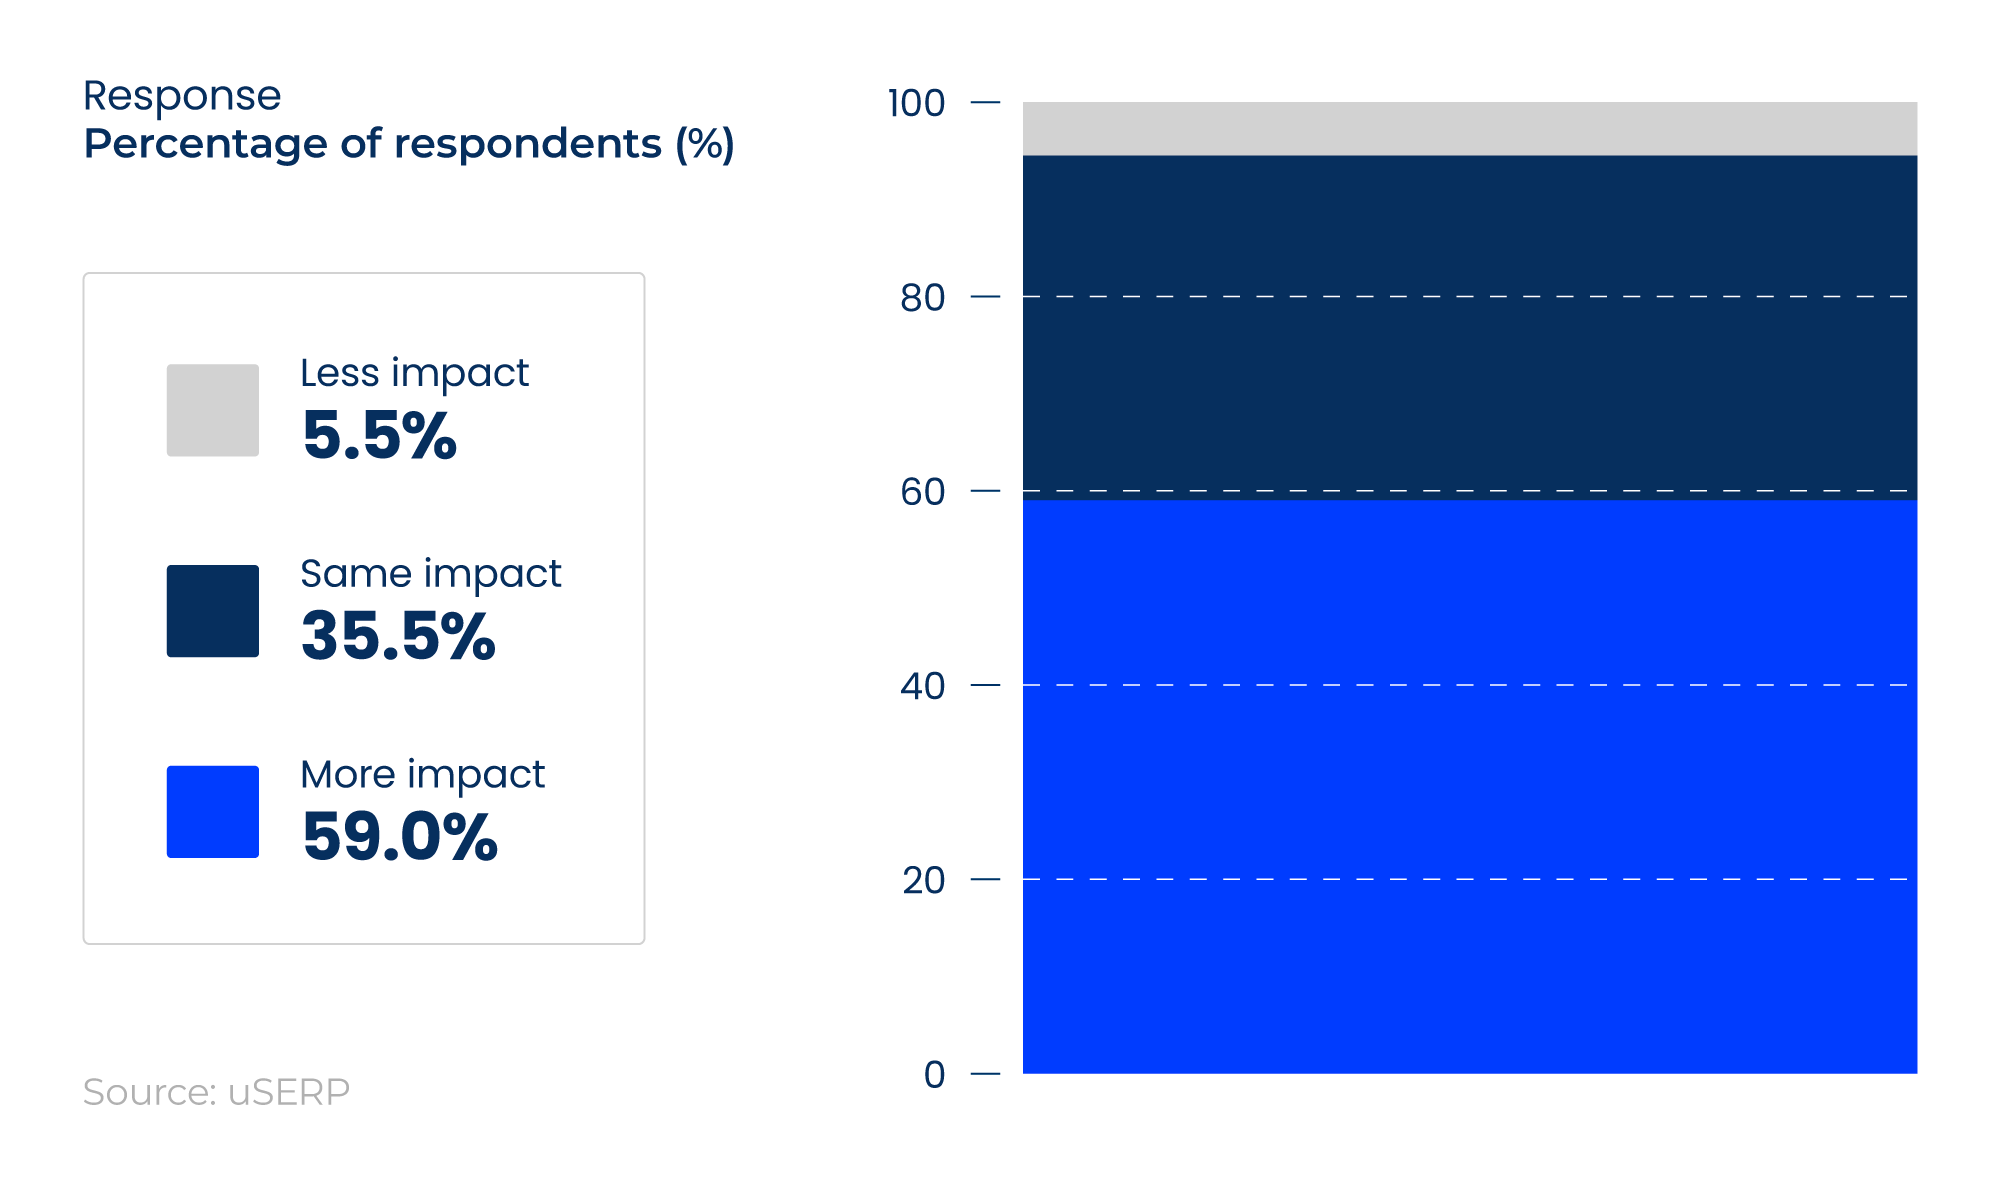
59% of those surveyed by uSERP think backlinks will have more impact on future search engine rankings, compared to 5.5% who believe they’ll have less impact.
Further SEO research by Backlinko found that:
-
Top-ranked search results usually have 3.8 times more backlinks than those in positions two to 10.
-
Around 95% of web pages have no backlinks.
-
Increasing time on a site by three seconds equates to a single position higher in the SERP.
-
The average load time for a first-page result on Google is 1.65 seconds. However, there is no correlation between page speed and rank position.
-
Most title tags on page one of Google contain 65% to 85% of the keyword that they rank for. However, there’s only a 1% difference between the #1 and #10 results, suggesting a weak correlation between title tag matching and ranking position.
-
The average URL rating across the top 10 Google results is 11.2. Pages ranked 1–6 have a median URL rating of 12, compared to 11 for pages ranked 7–10.
-
The average first-page Google result contains 1,447 words. Although there’s no direct relationship between word count and rankings, there's also no correlation between page HTML size and rankings.
-
The average URL length for a top 10 result in Google is 66 characters, with most falling between 40 and 100 characters. URLs at position #1 are, on average, 9.2 characters shorter than those in position #10.
-
Long-form content (i.e., that with 3,000 or more words) receives 77.2% more backlinks than that with 1,000 words or fewer.
"These trends largely come down to how well content satisfies search intent. Pages that rank highly tend to offer more comprehensive, relevant answers, which naturally leads to stronger engagement and attracts high-quality backlinks over time. For example, well-structured, in-depth content supported by credible sources and clear UX is more likely to earn links and keep users on the page.
However, it’s important to note that these are correlations, not definitive ranking factors. Google’s algorithm considers hundreds of signals, many of which aren’t publicly disclosed, and their weighting can shift over time. This makes it difficult to isolate any single factor as the cause of higher rankings.
In practice, best results come from a holistic approach, combining strong content, technical optimisation, and authority building, rather than trying to optimise for individual metrics in isolation."
Caitlin Furborough
eCommerce SEO statistics
According to our latest eCommerce SEO statistics report, the average eCommerce brand ranked for 1,783 keywords in organic search results in 2025. This drove an estimated 9,625 organic monthly visits to eCommerce sites.
To acquire a similar amount of traffic via paid search, this would cost almost £11,800 per month.
Our findings show that:
-
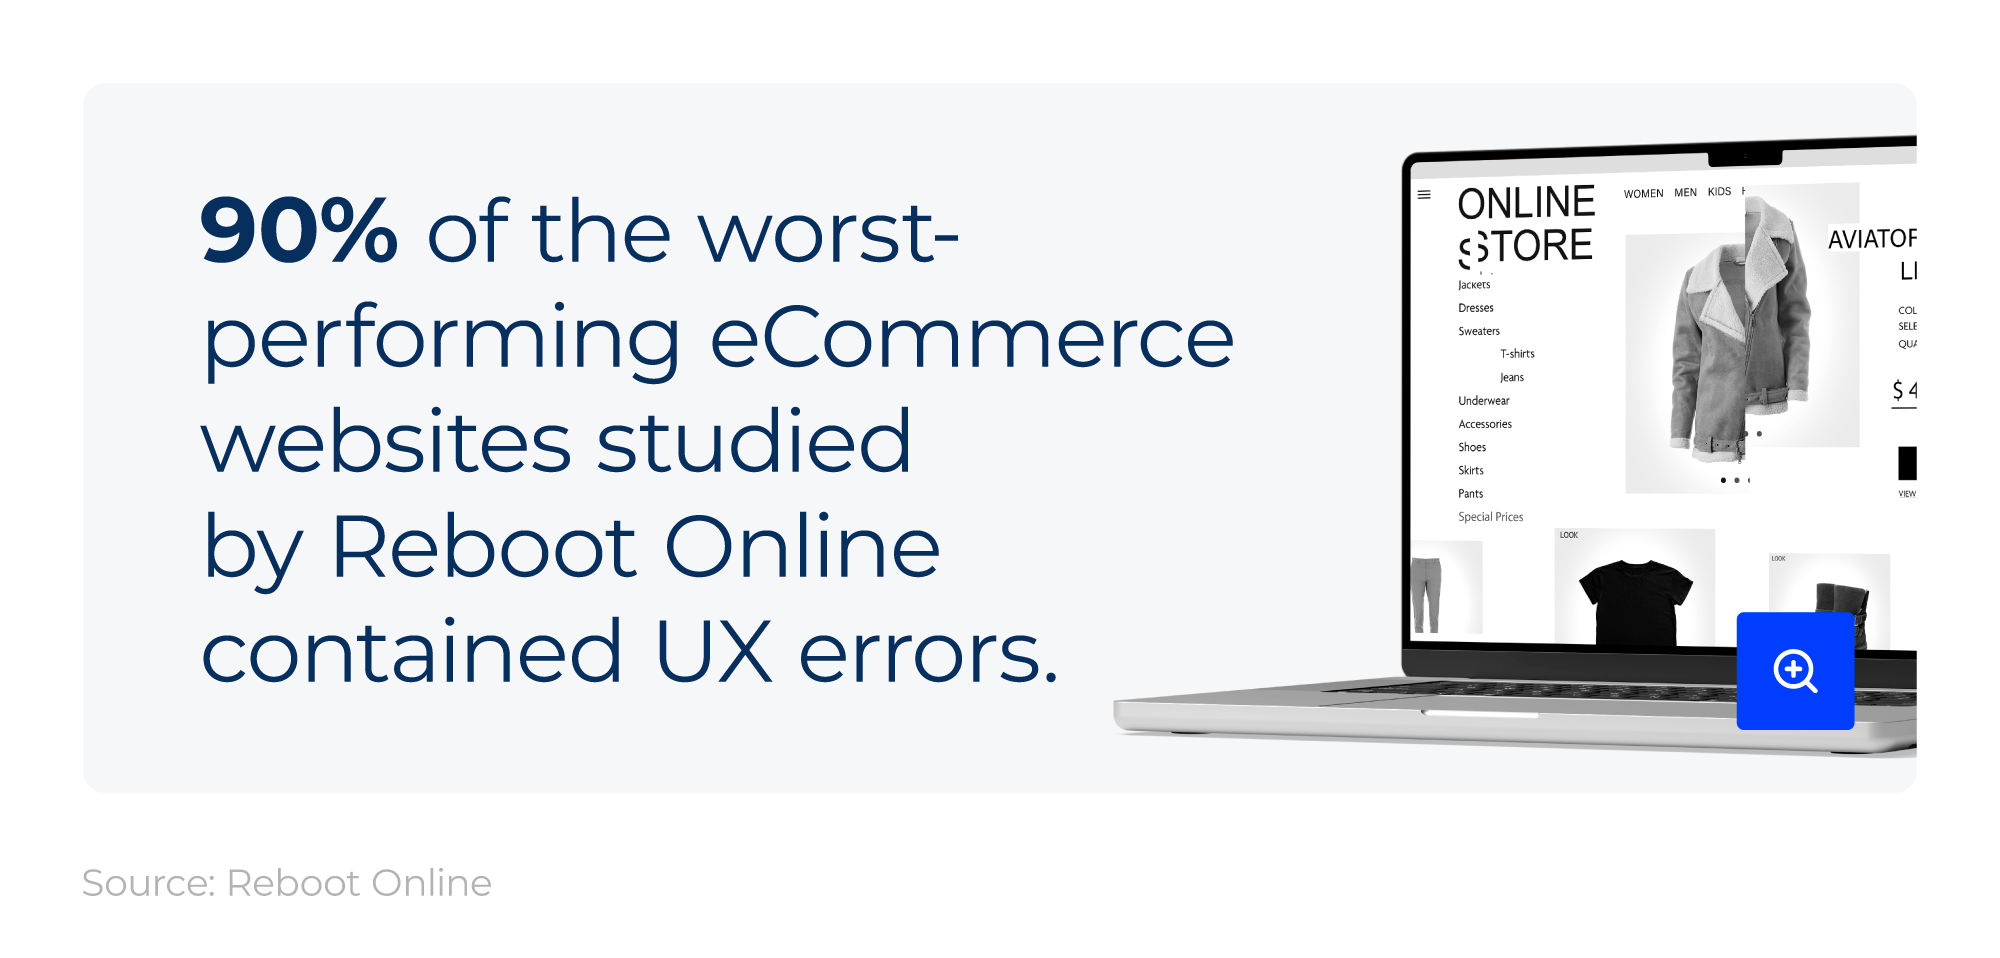
90% of the worst-performing eCommerce websites studied in 2024 contained user experience (UX) issues.
-
The average eCommerce website achieved a Google Lighthouse score of 67 out of 100 for site speed and performance.
-
70.5% of these sites were rated as ‘needs improvement’ with scores between 50 and 89 out of 100. 16% were listed as good (90+), and 8.5% rated as poor (<49).
-
62.4% had at least one broken link, and 53% lacked canonical tags.
-
The average eCommerce page title was 39 characters (significantly below the industry-best practice recommendation of 50 to 60). Just 15.17% contained fewer than 15 characters.
-
The average eCommerce meta description was 96 characters (significantly below the industry standard of 150 to 160 characters).
-
52% were deemed very easy or fairly easy to read.
-
73% of the biggest eCommerce brands had user-generated content (UGC) across their websites compared to 98% of the lowest-performing sites.
-
Duplicate content was apparent in 38% of eCommerce websites analysed, with 92% of the worst-performing brands suffering from thin content.
-
On average, 86% were lacking an optimised internal linking strategy (a figure that was still 41% for the most organically visible brands).
TABLE 11: ECommerce engagement rate statistics, March 2026
|
Form of engagement |
Mobile |
Desktop |
Tablet |
Overall |
|---|---|---|---|---|
|
Device usage (%) |
74% |
25% |
1% |
100% |
|
Conversion rate (%) |
2.53% |
1.89% |
2.61% |
2.31% |
|
Add-to-cart rate (%) |
5.97% |
4.56% |
5.79% |
5.62% |
|
Cart abandonment rate (%) |
80.94% |
69.47% |
71.58% |
78.48% |
|
Average order value ($) |
$224 |
$250 |
$196 |
$229 |
Source: Data from Dynamic Yield’s Explore eCommerce statistics and KPI benchmarks to see how you stack up, Device Usage
Note: Statistics were collected by filtering by device.
As of March 2026, the average eCommerce SEO conversion rate is around 2.31%. This can vary by device, ranging from 1.89% on desktops to 2.61% on tablets.
Overall, almost three-quarters of people use mobile devices for eCommerce, with most of the rest using desktops.
The average add-to-cart rate for eCommerce is about 5.62%, compared to 78.48% for the typical eCommerce cart abandonment rate.
Did you know?
19% of product searches result in a Google Shopping click.
Average CTR for SEO
Recent SEO statistics suggest that an average click-through rate (CTR) of at least 3% is considered good for SEO.
This implies that for every 100 people who visit your site, three will click on it.
Studies by Backlinko show that:
-
URLs containing similar terms to a keyword have a 45% higher CTR compared to those without a keyword.
-
Positive title tags improve CTR by around 4%.
-
90.3% of all queries on Google Search Console (GSC) have 10 or fewer impressions. This suggests that most of the keywords a site ranks for are long tail, that the site isn’t ranking highly for them, or both.
-
The average number of clicks per query stands at 25.1. As a result, ranking for a given number of keywords might not be a valuable SEO metric, as most pages rank for keywords with little search volume.
-
The average CTR for titles with questions is around 15.5% vs 16.3% for those with regular titles.
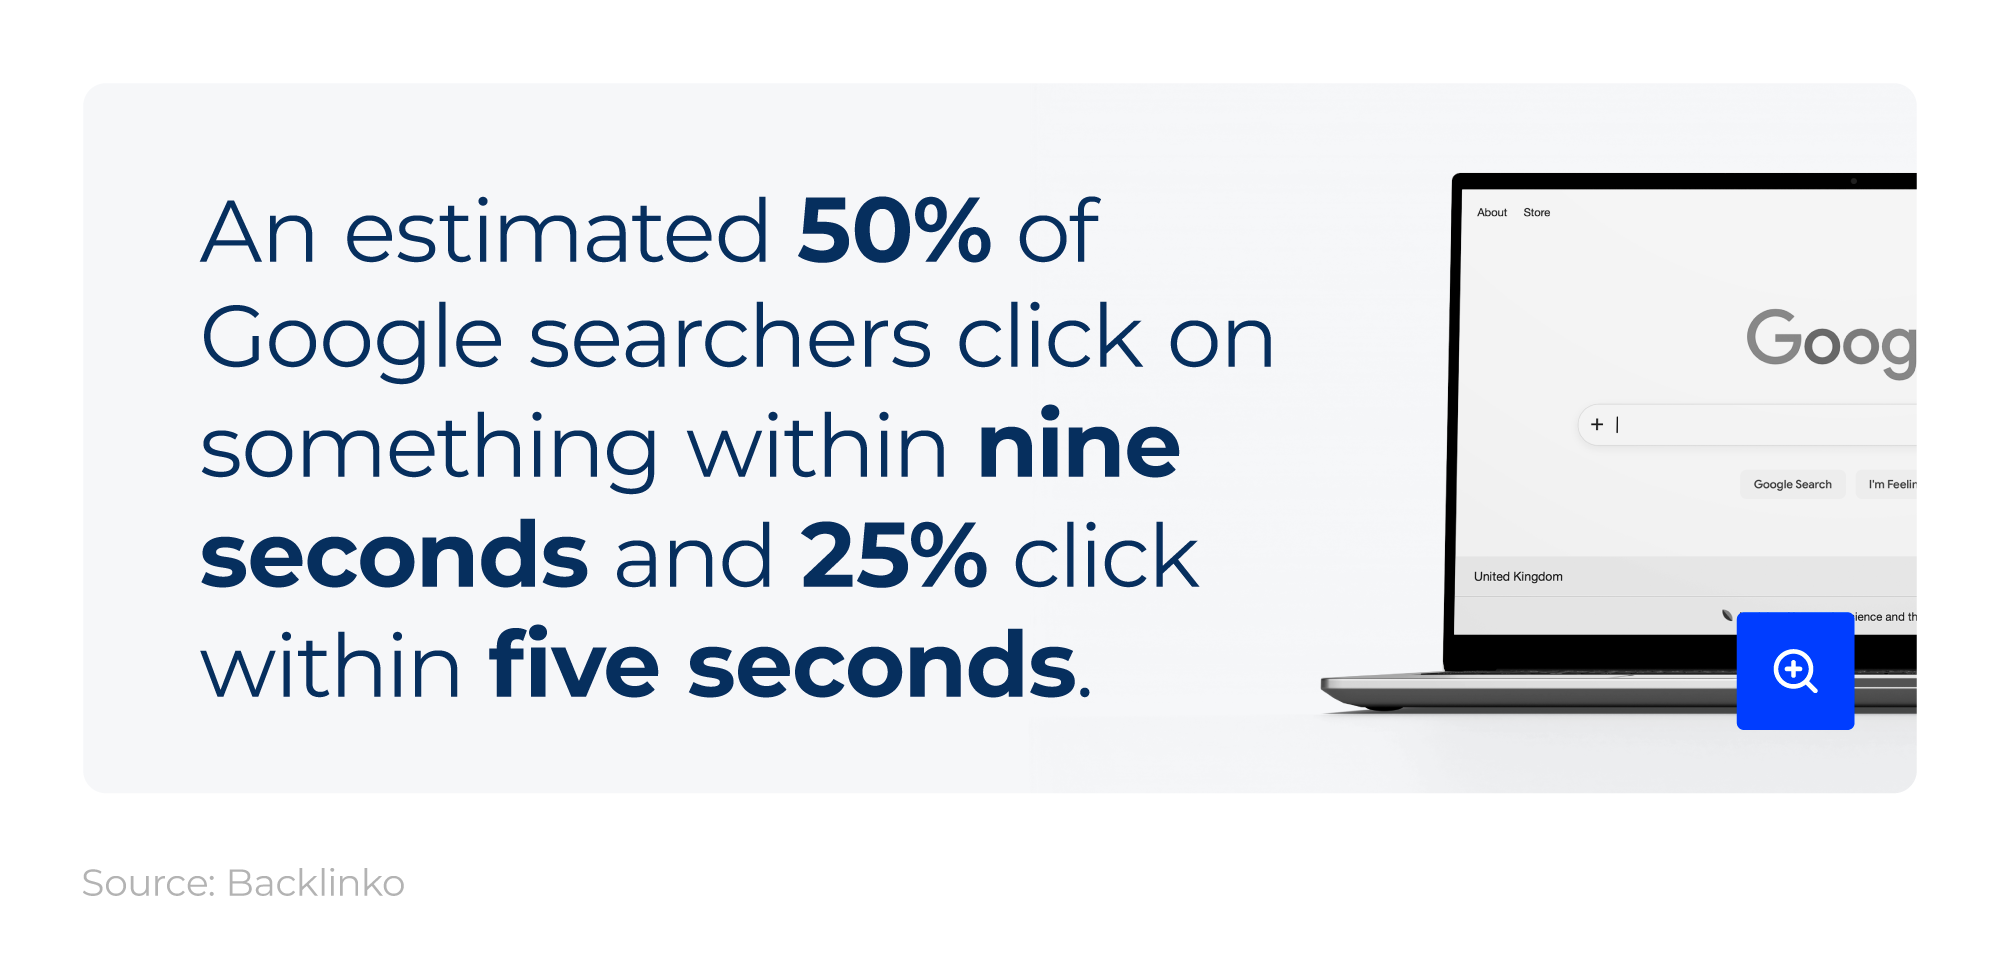
It’s estimated that 50% of Google searchers click on something within nine seconds, and 25% click within five seconds.
The average time to a first click is approximately 14.6 seconds, and only 9% of users scroll to the bottom of page one.
SEO analysis by Backlinko on Google user behaviour suggested that:
-
85% find an answer to their query using their initial search term.
-
83% don’t return to the search engine results page (SERP) after selecting a page.
-
59% click on a single result, with 6% visiting four or more pages before finding an answer to their query.
-
65% click on the organic result at least once during their session.
-
19% click on a Google Ad during their search.
-
Only 3% interact with the people also ask box, despite it being one of the most prominent features across all SERPs (43.21% of all Google search results include it).
In all, the average Google search session lasts roughly 76 seconds, with 25% of searches lasting less than 31 seconds.
"Zero-click searches are growing because Google and AI tools now answer more questions directly on the results page, so people don’t always need to click through.
AI Overviews are a big part of this, pulling together information and giving users quick answers.
This is where SEO and GEO (Generative Engine Optimisation) are both important, as brands now need to optimise not just for search rankings but also for AI-generated results. While this can reduce overall website traffic, it also creates new opportunities for visibility.
From a commercial perspective, being on page one is more important than ever. Even with fewer clicks overall, higher rankings still drive stronger click-through rates, which directly impact conversions, sales, and revenue.
As visibility becomes increasingly competitive, brands that don’t appear in these key areas risk missing out on valuable traffic and demand."
Katrina Lazurinaite
Average CTR for web pages based on rank position

The number one result in Google’s organic search has an average CTR of 27.6% and is around 10 times more likely to receive a click than the result in position 10.
The average CTR for SEO decreases with each position, with web pages in position two receiving about three times as many clicks as those in position seven.
The top three results get 54.4% of all clicks; only 13.7% of Google searchers click on something from page two or beyond (or not at all).
Average CTR for branded keywords or homepage
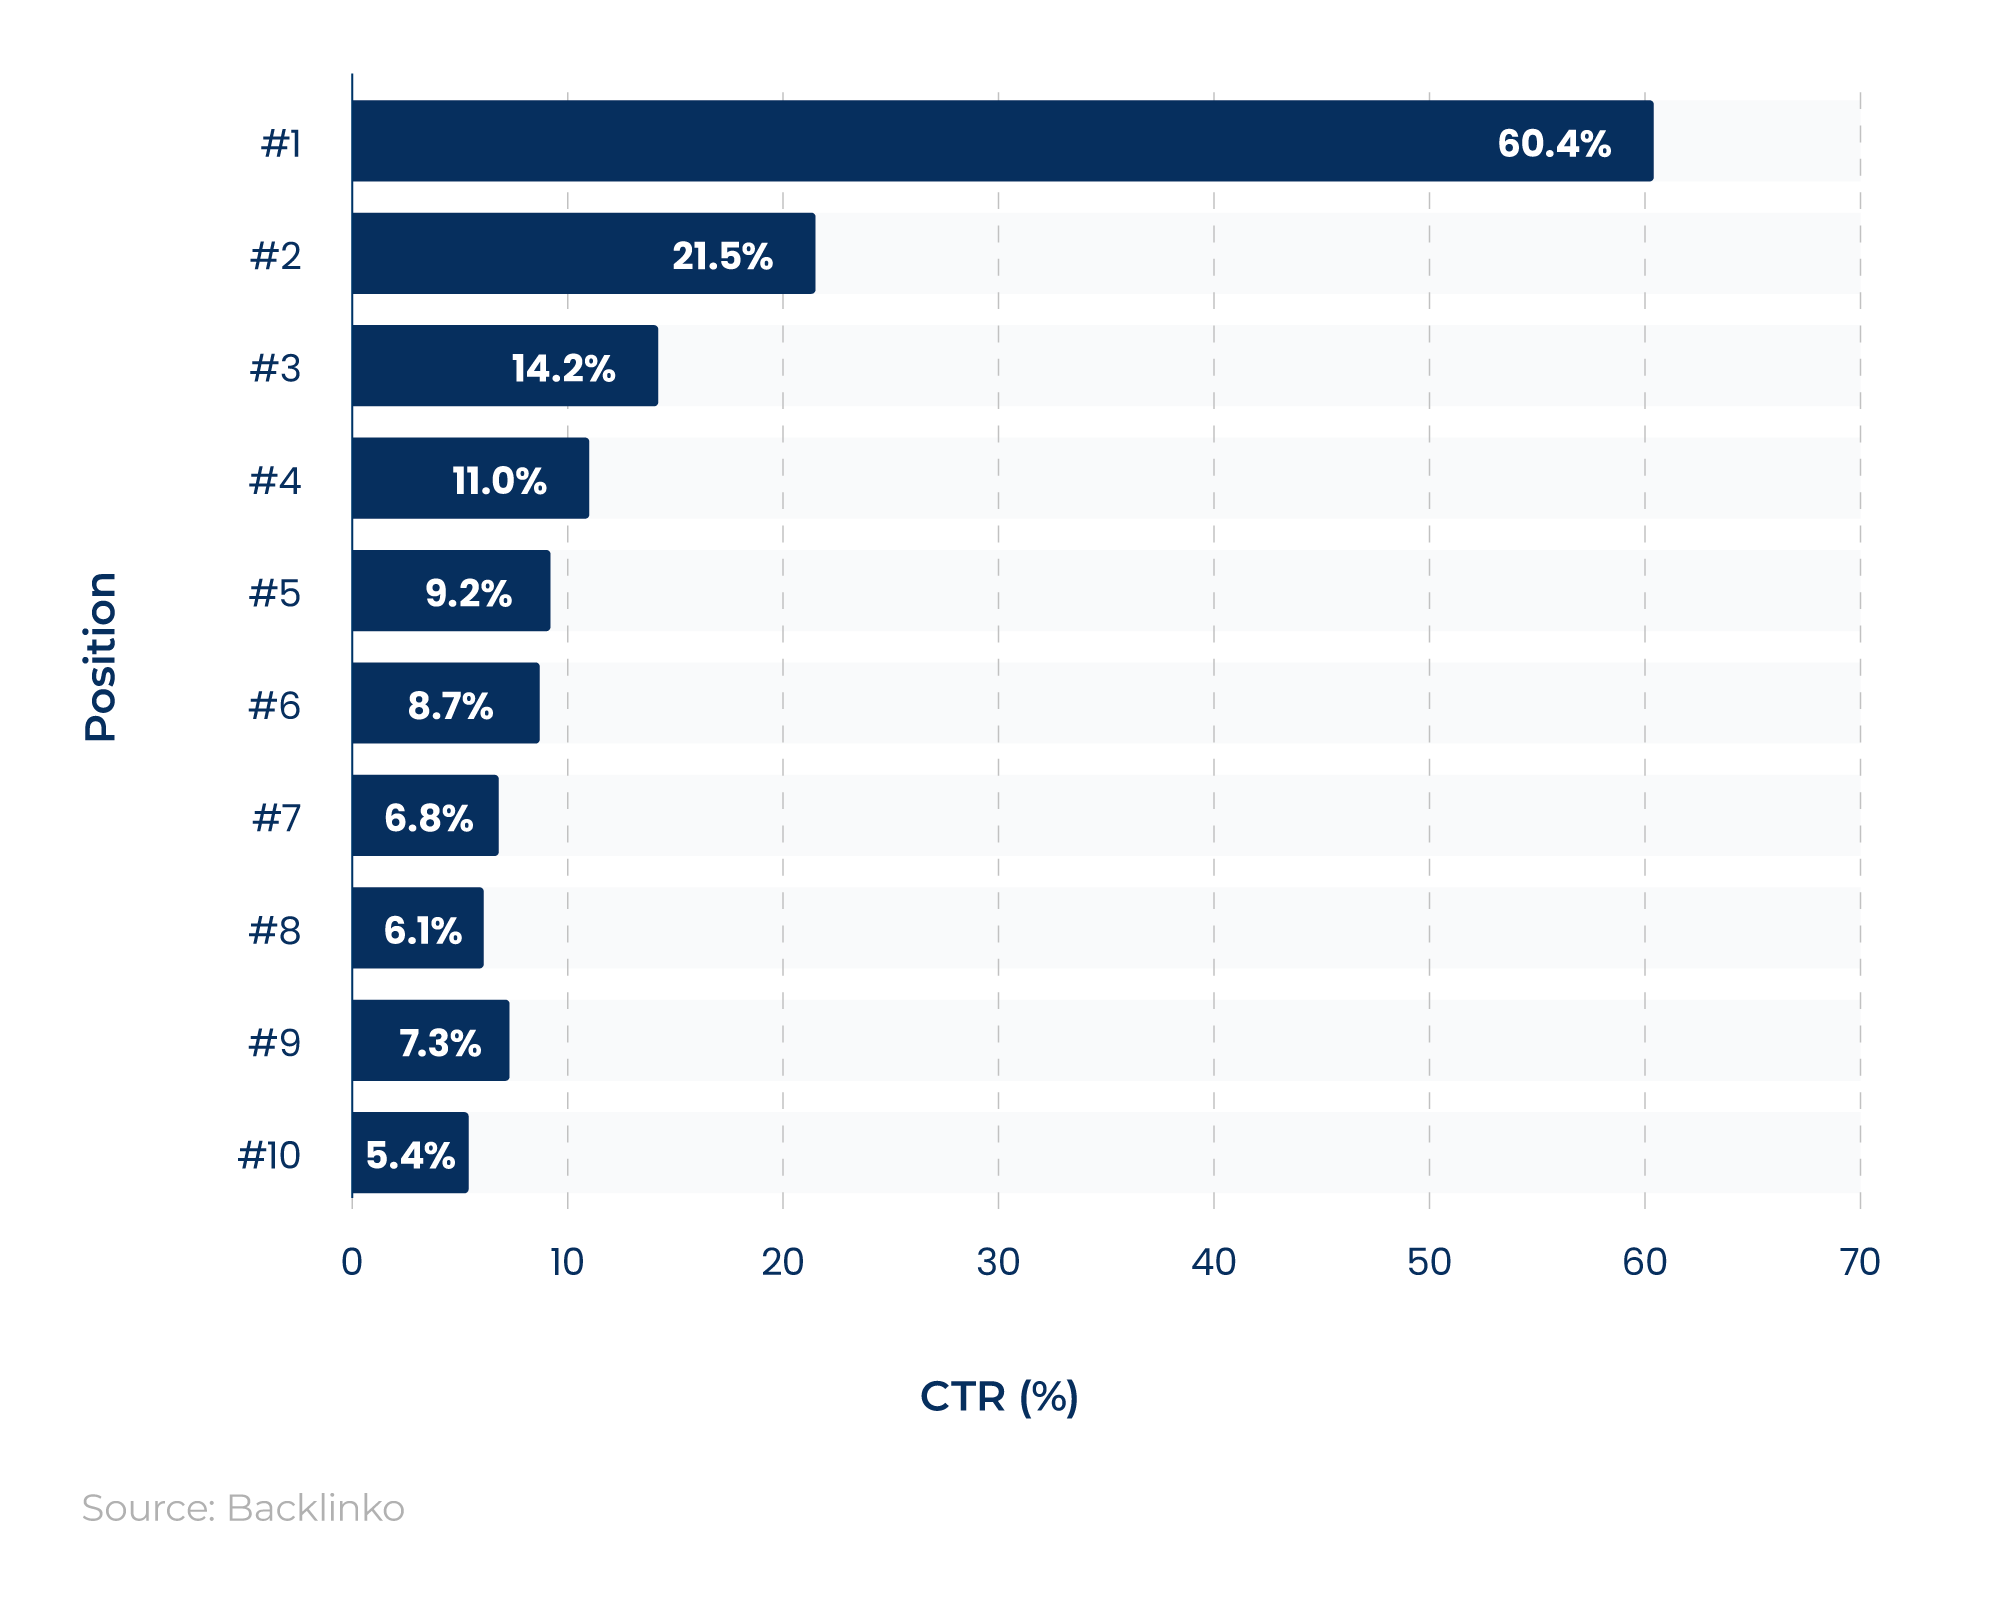
The average organic CTR for branded keywords and the homepage is typically greater than that of non-branded keywords. For example, those in position one receive 60.4% of clicks (more than double the average CTR for non-branded keywords in position one).
At the other end of the SERP, around one in 20 people click through to a branded keyword or the homepage in position 10, compared to approximately one in 50 for non-branded keywords.
Average CTR change based on position change in the SERP
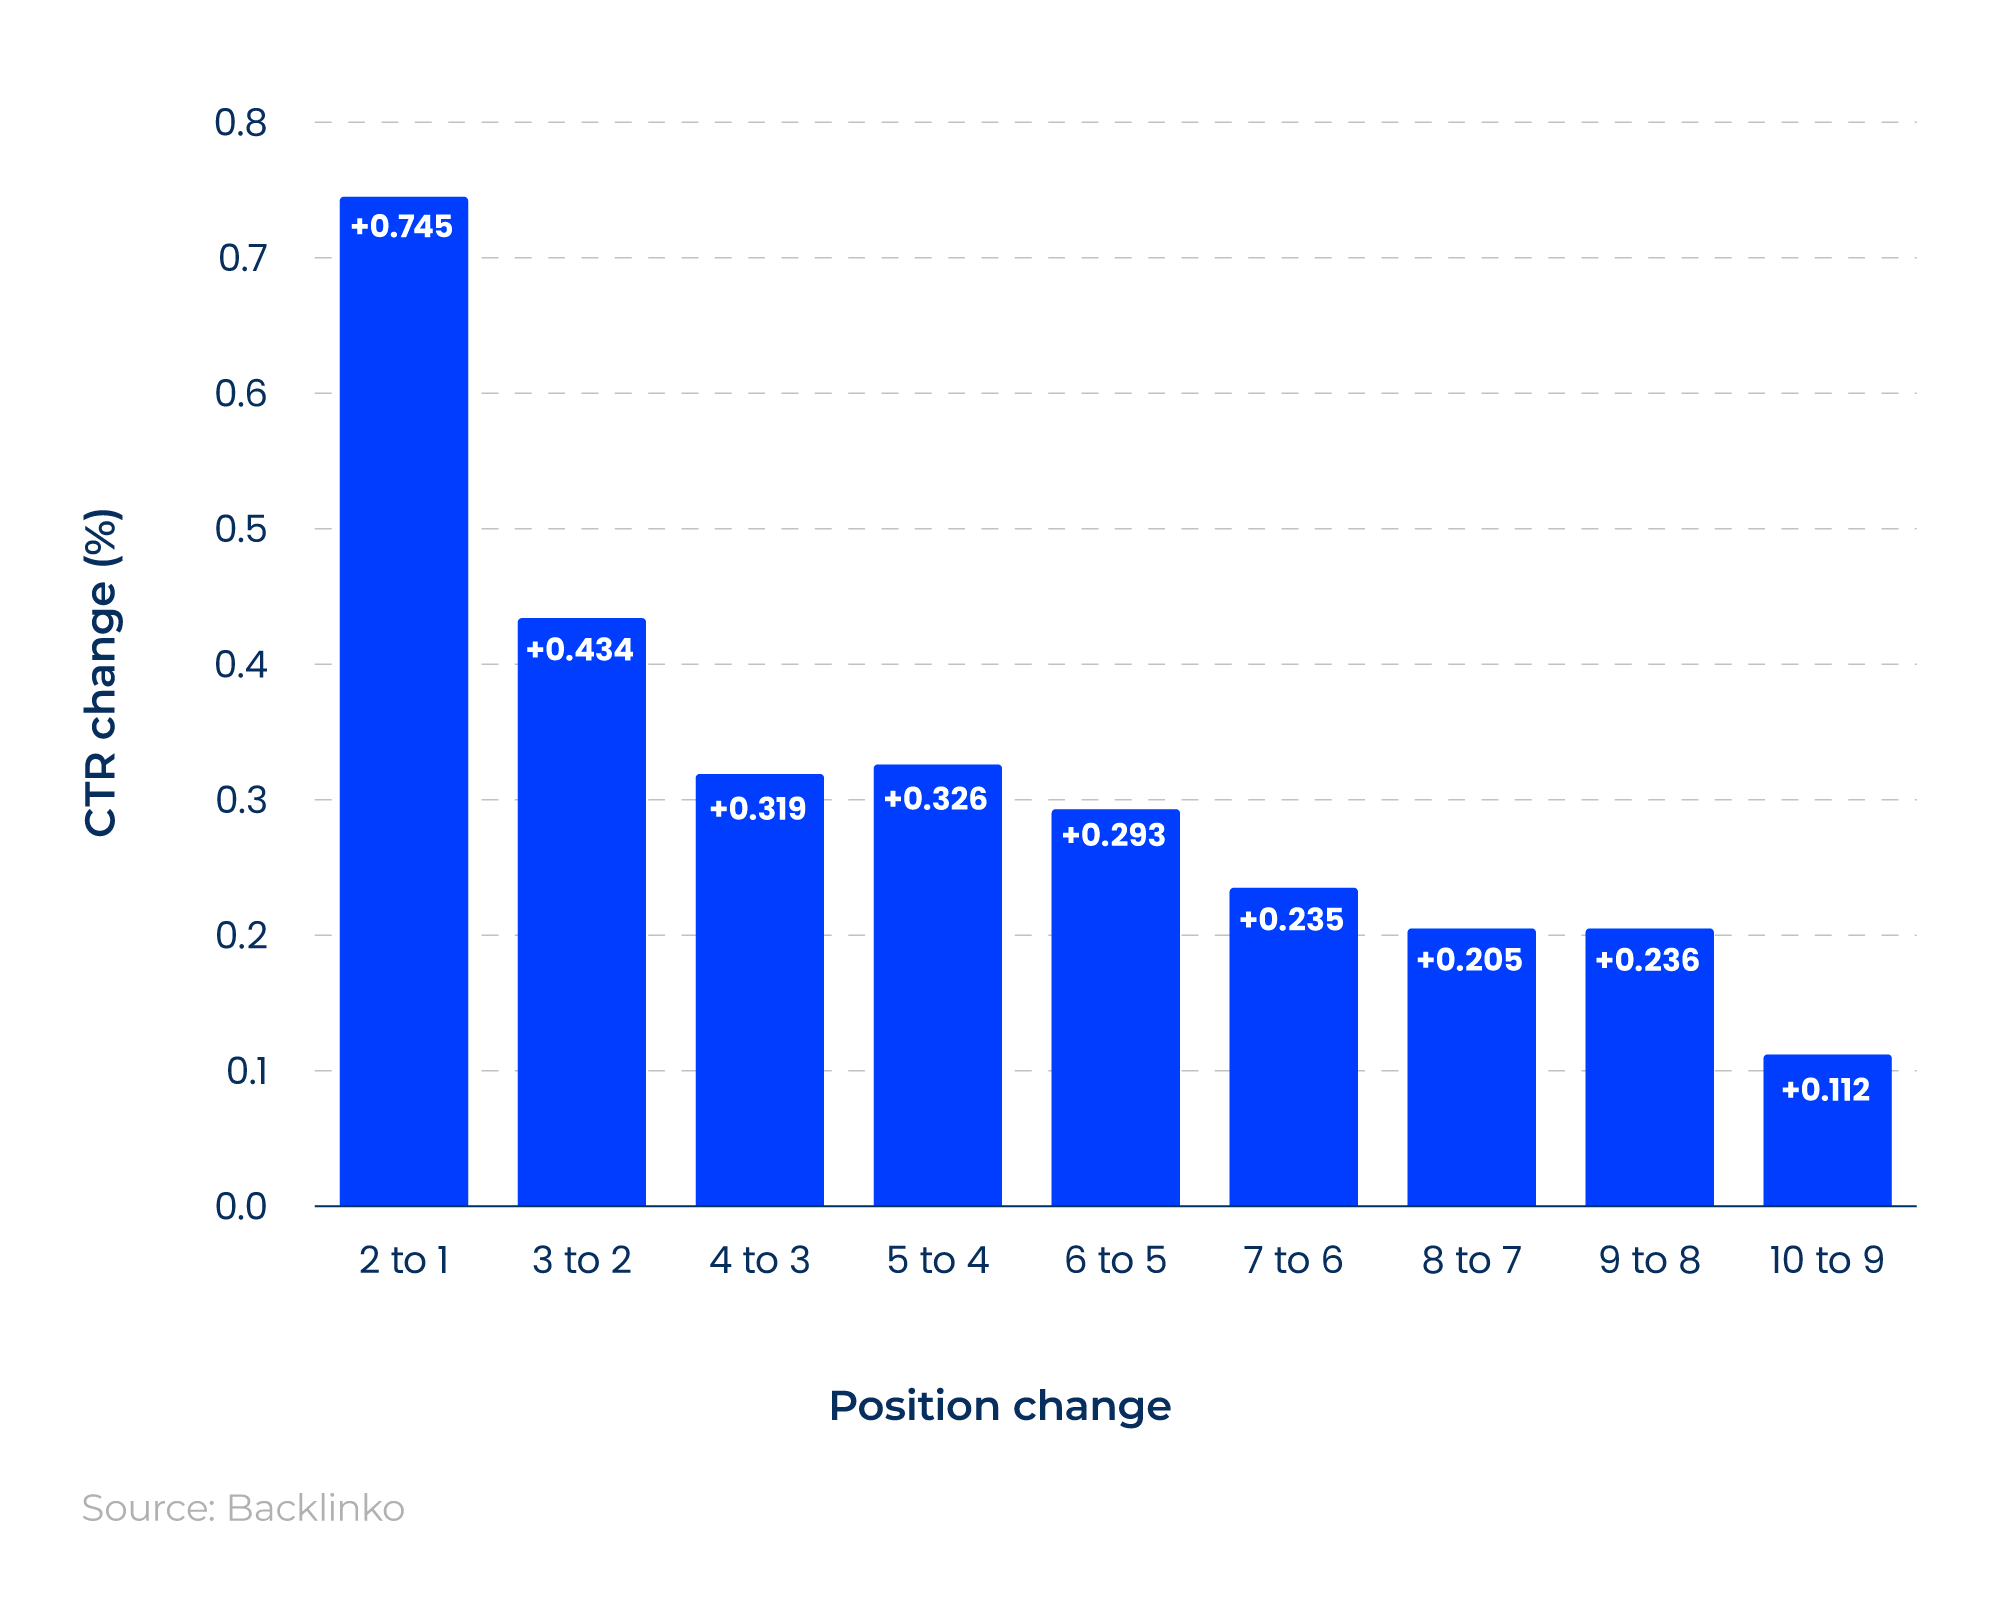
SEO statistics from Backlinko suggest that moving up one spot in the search results could increase your CTR by an average of 2.8%, but this depends on where you’re moving from and to.
For example, the average organic CTR for positions eight to 10 is virtually the same. So, moving up a few spots at the bottom of page one may not bring any additional traffic to your site. Yet, moving from position two to one in the SERP could boost your CTR by almost three-quarters.
TABLE 12: Average CTR for SEO based on title tags and character length
|
No. of characters |
CTR (%) |
|---|---|
|
0–20 |
27.9% |
|
20–40 |
25.6% |
|
40–60 |
33.3% |
|
60–80 |
23.6% |
|
80+ |
21.9% |
Source: Data from Backlinko’s We Analyzed 4 Million Google Search Results. Here’s What We Learned About Organic Click Through Rate, Title Tags Between 40 to 60 Characters Have The Best CTR
Title tags between 40 and 60 characters tend to have the highest average CTR for SEO, at 33.3%, compared to 21.9% for those with 80 or more characters.
Average CTR for SEO based on title tags and the length of keywords
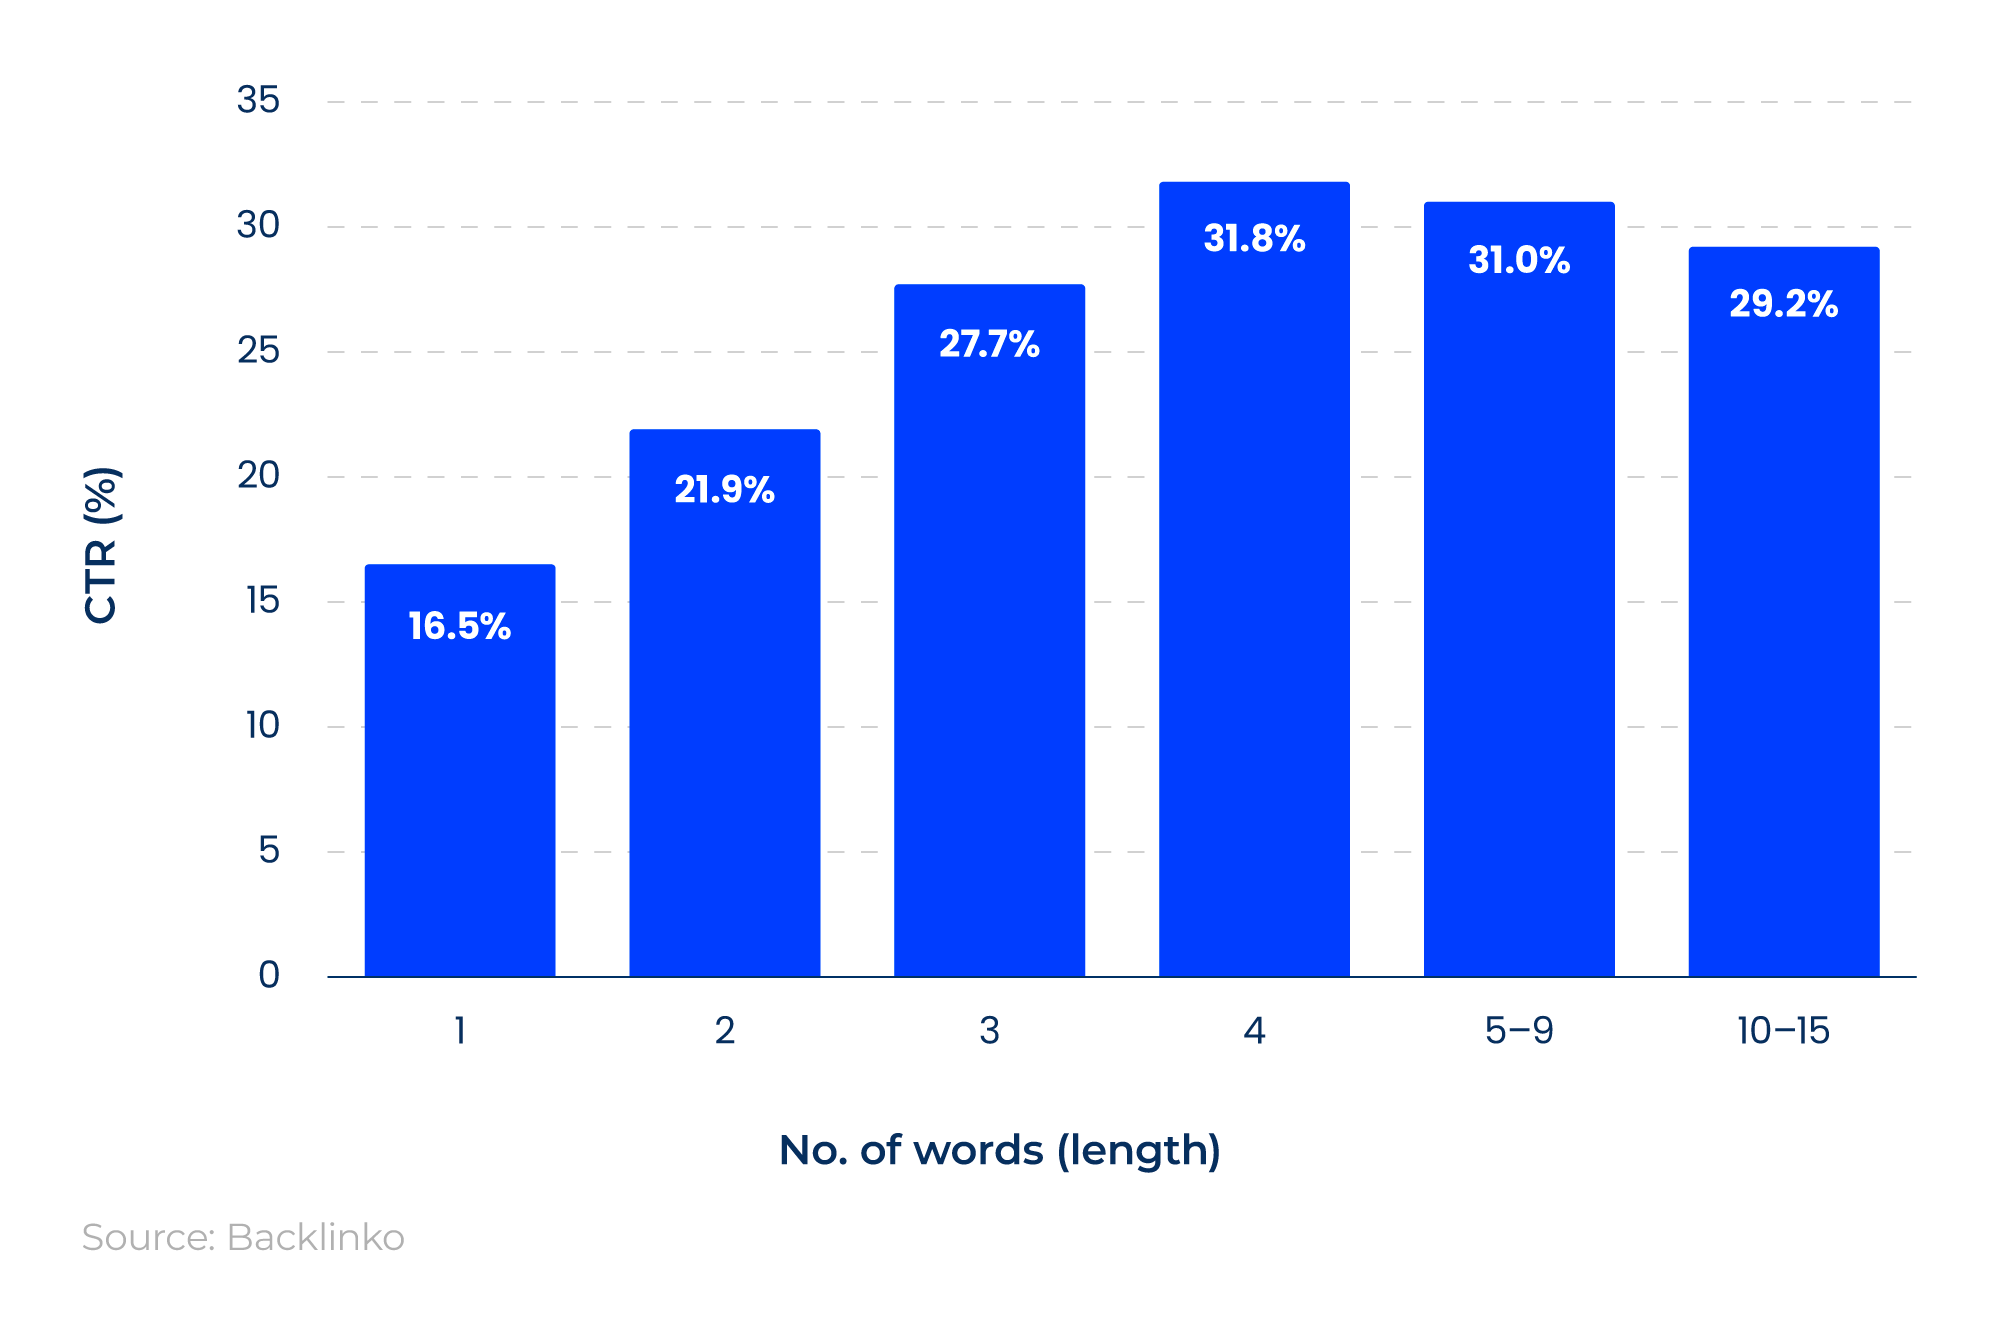
Longer keywords tend to have a higher CTR than shorter ones.
For example, those with four to nine keywords get almost twice as many clicks as those with just one word. Linked to specific search intent, the user likely knows exactly what they’re looking for and is more likely to click through.
Average CTR for SEO by industry
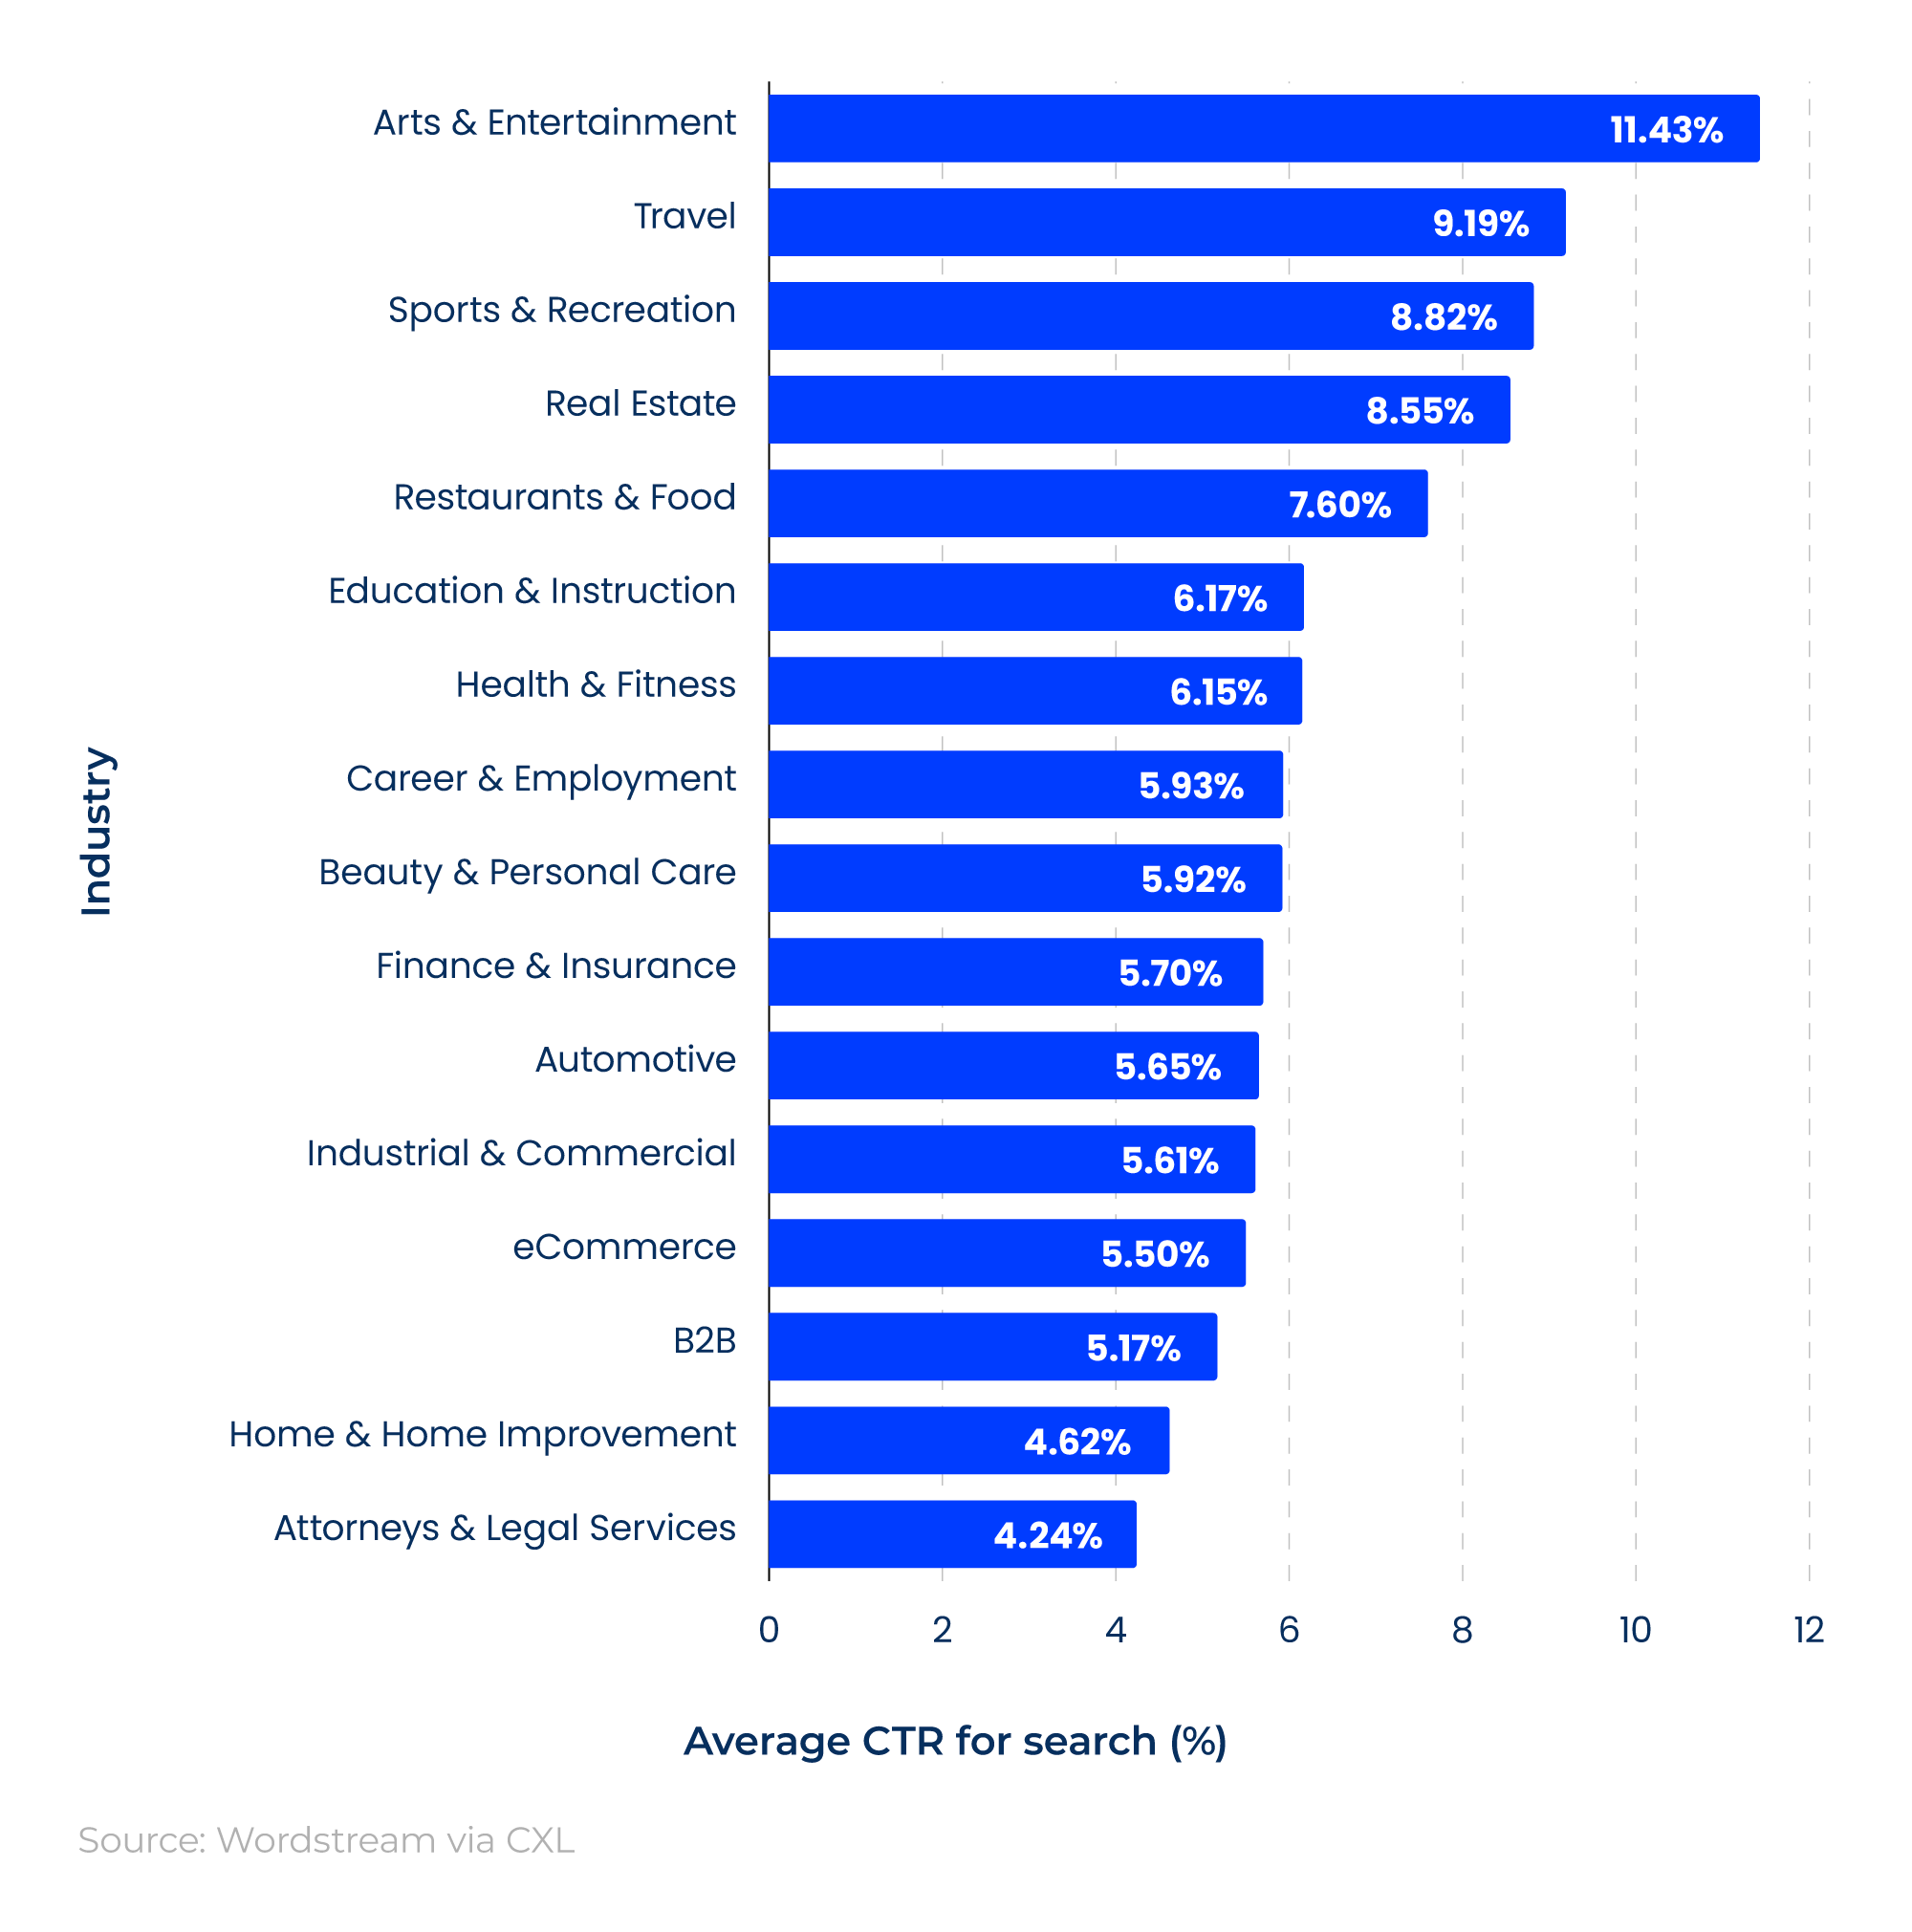
According to recent SEO statistics, websites in the arts and entertainment sector have the highest average CTR across all industries, at 11.43%. This is followed by those in travel (9.19%) and sports and recreation (8.82%).
The WordStream study cited by CXL found that the lowest average CTR for SEO was among pages offering attorneys and legal services (4.24%) and home and home improvements (4.62%).
This means websites in the arts and entertainment sector are almost three times as likely to have customers click through to their pages as those in the attorneys and legal services industry.
Mobile SEO statistics
SEO stats cited by ReviewTrackers and Semrush reveal that:
-
57% of local searches come from a mobile or tablet device.
-
Only 17% of websites maintain their search engine ranking positions across mobile and desktop devices.
-
On average, 37% lose their position in the SERP on mobile vs desktop.
Therefore, making your site SEO-friendly and optimised for mobile devices is a key element for successful rankings and maintaining SERP performance.
Global mobile vs desktop vs tablet market share over time, March 2025–March 2026
As of March 2026, mobiles had the majority of market share across all global devices at 55%, followed by desktops (43.31%) and tablets (1.69%).
The dominance of mobiles in the global communications market decreased throughout 2025–26, falling by almost 13 percentage points in 12 months. This trend saw desktops’ market share increase from 36.06% in March 2025 to 43.31% just a year later.
SEO voice search statistics
It’s estimated that 50% of US consumers use voice search daily, resulting in more than a billion voice searches nationwide each month.
Furthermore, 70% of voice search results come from Google’s featured snippets and people also ask.
SEO voice search trends
SEO market research by GWI found that:
-
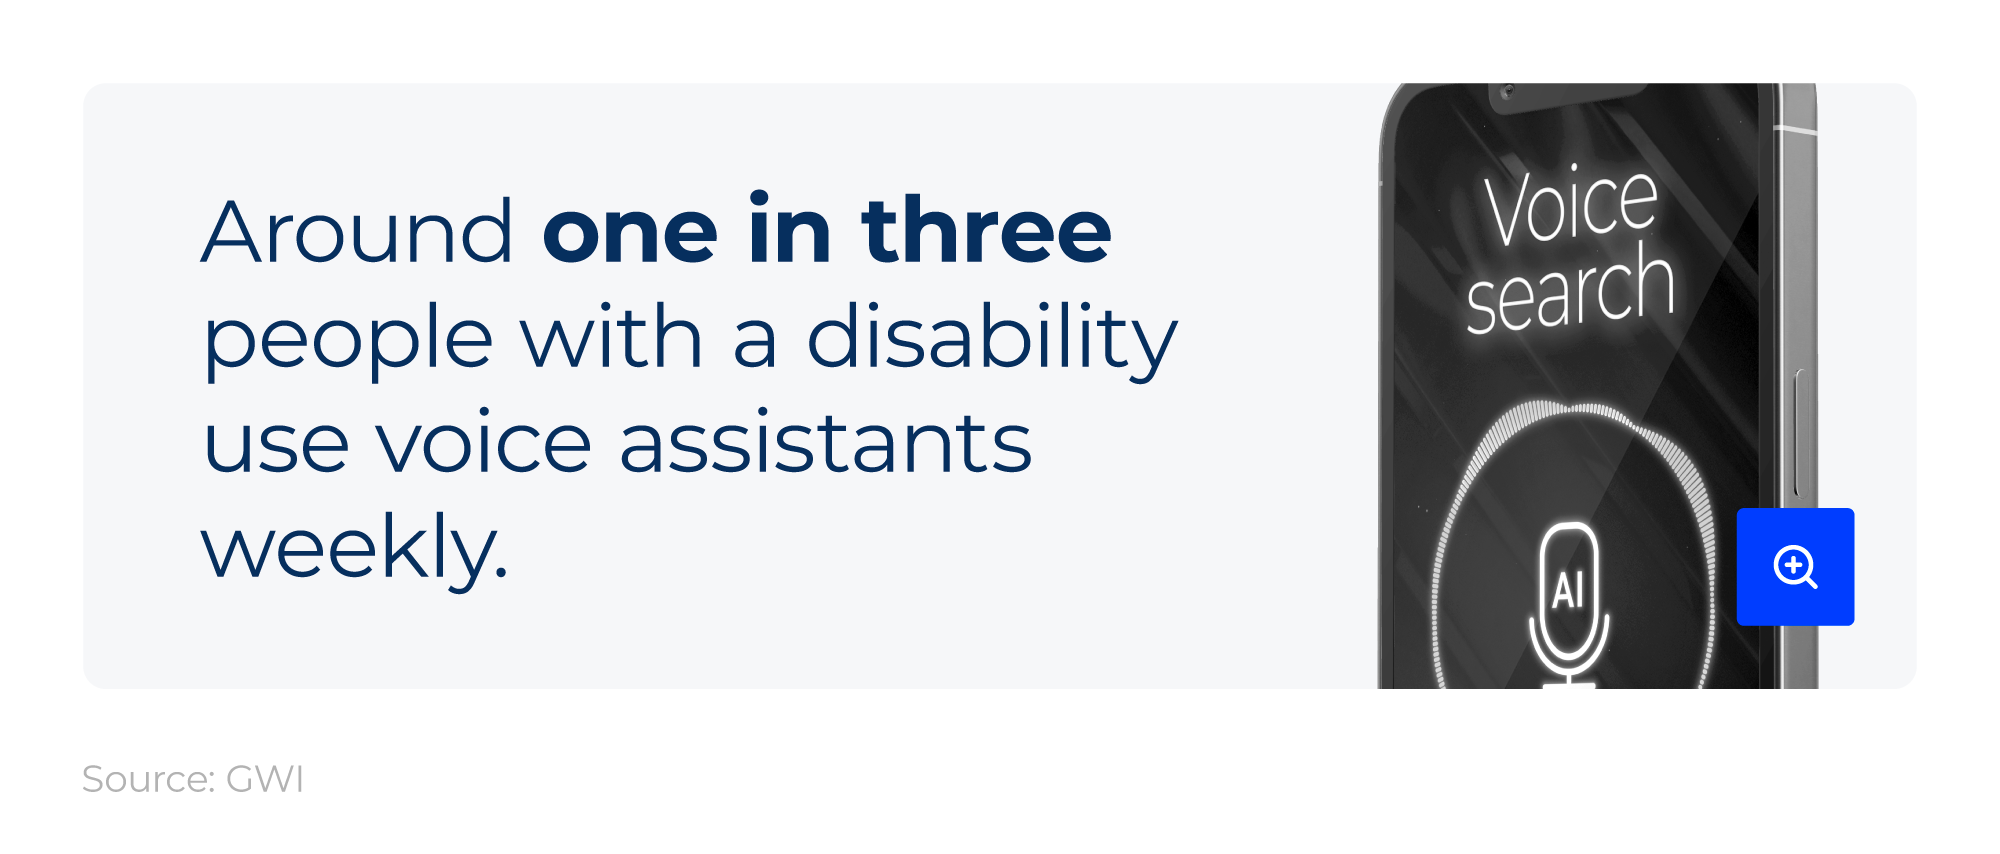
Around one in three people with a disability use voice assistants weekly.
-
The use of voice assistants is an important part of people’s lives; roughly one in 10 consumers with a visual impairment lives alone, and more than one in four do online food shopping at least once a week.
-
32% have used a voice assistant in the past week (21% to find information and 20% to complete an action).
-
Almost one in three voice assistant users has used ChatGPT within the past month.
-
Voice assistant users are 59% likelier to say that integration with other apps and services is a key part of how they use AI.
-
More than one in 10 Gen Z users say voice integration is the single most important feature when using AI tools.
-
Voice assistant users are 33% more likely than the average consumer to have made an online purchase in the past week, and 51% more likely to have ordered food through a delivery app.
SEO statistics from Bikash Yadav also show that 27% use voice search on their mobile devices, and 35% use smart speakers.
Furthermore, an analysis of 10,000 Google Home search results shows that:
-
The average search result page loads in 4.6 seconds (52% faster than the average web page, which loads in 8.8 seconds).
-
70.4% of Google Home results pages are secured with HTTPS (compared with only 50% of Google desktop results).
-
The average voice search result is 29 words in length.
-
36.4% of voice search results come from pages that use Schema (compared to the global average of 31.3%).
-
The average Ahrefs Domain Rating of voice search results is 76.8, with an average page rating of 21.1.
-
Only 1.71% of voice search results use the exact target keyword in their title tag.
-
The average word count of a voice search results page is 2,312 words.
-
Roughly 75% of voice search results rank in the top three results for that query.
-
40.7% of voice search responses came from a featured snippet.
Average voice search result rankings in desktop search
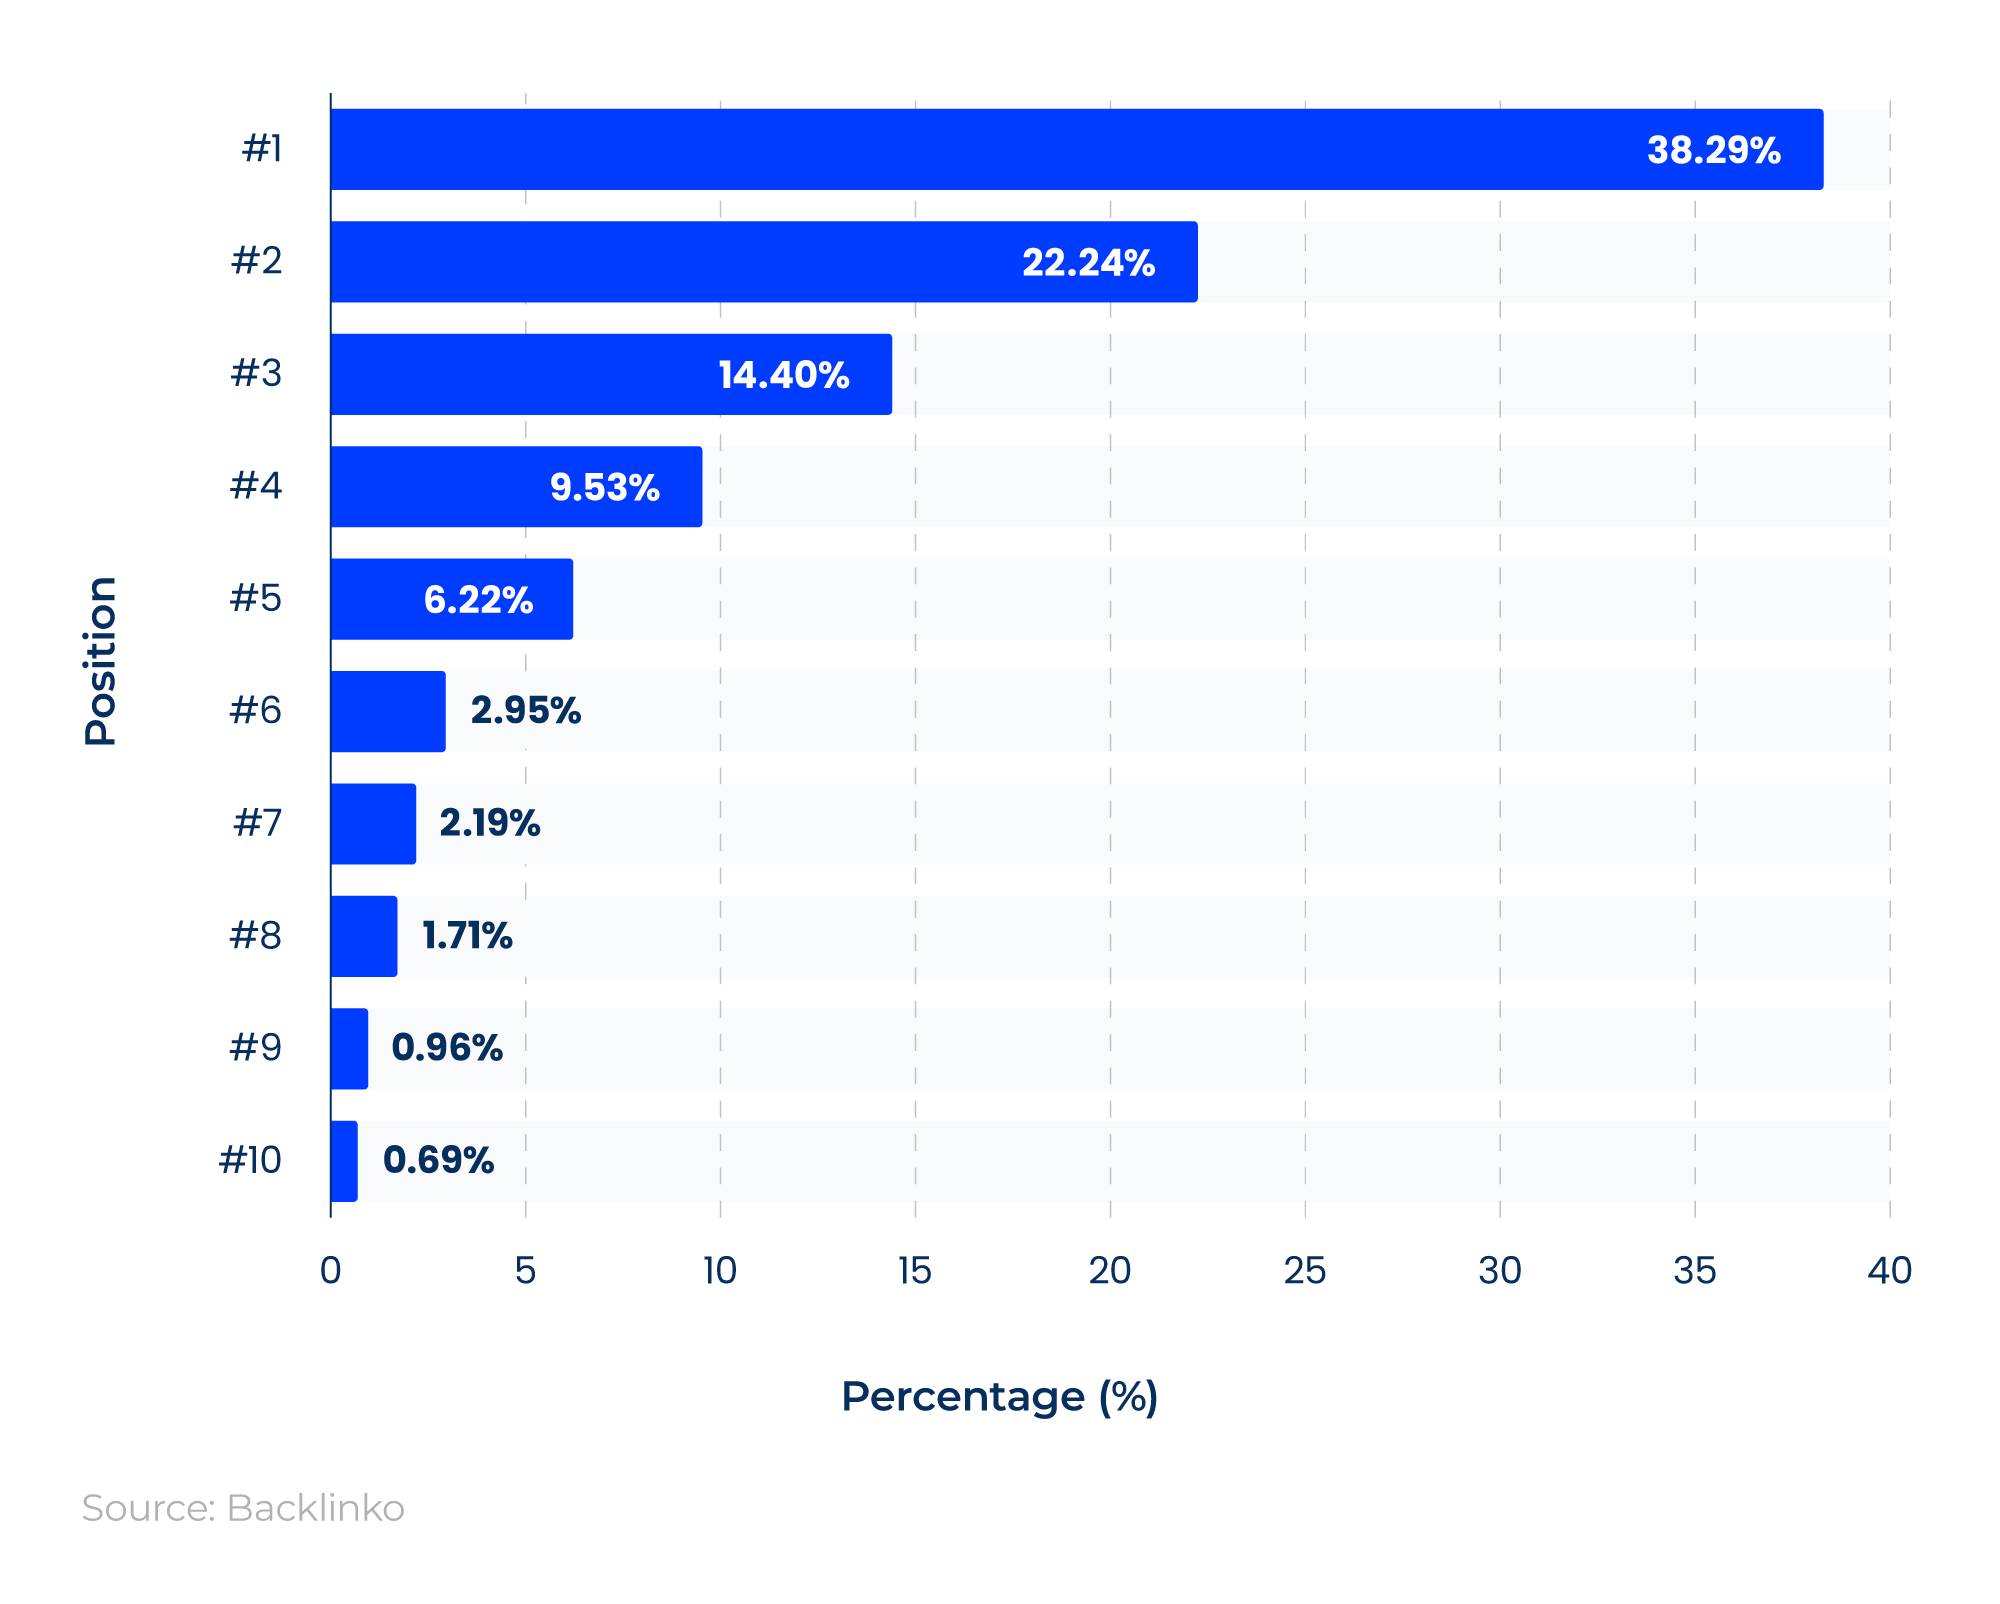
Voice search statistics from Backlinko show that the higher a page ranks for a keyword, the more likely it is to appear in voice search results.
Almost three-quarters of voice search results ranked in positions one to three, with 38.29% in the top spot.
In total, 99.18% of voice search results on desktops came from web pages in positions one to 10. This means that if your site doesn’t appear on page one of the SERP, you have a 0.82% chance of appearing in the search results when searching by voice.
SEO voice search user statistics
As of October 2025, 22.8% of internet users aged 16 and above used voice assistants weekly. This figure rose to 26.4% in the UK and 29.3% in the US.
Percentage of internet users who use voice assistants weekly by age and gender
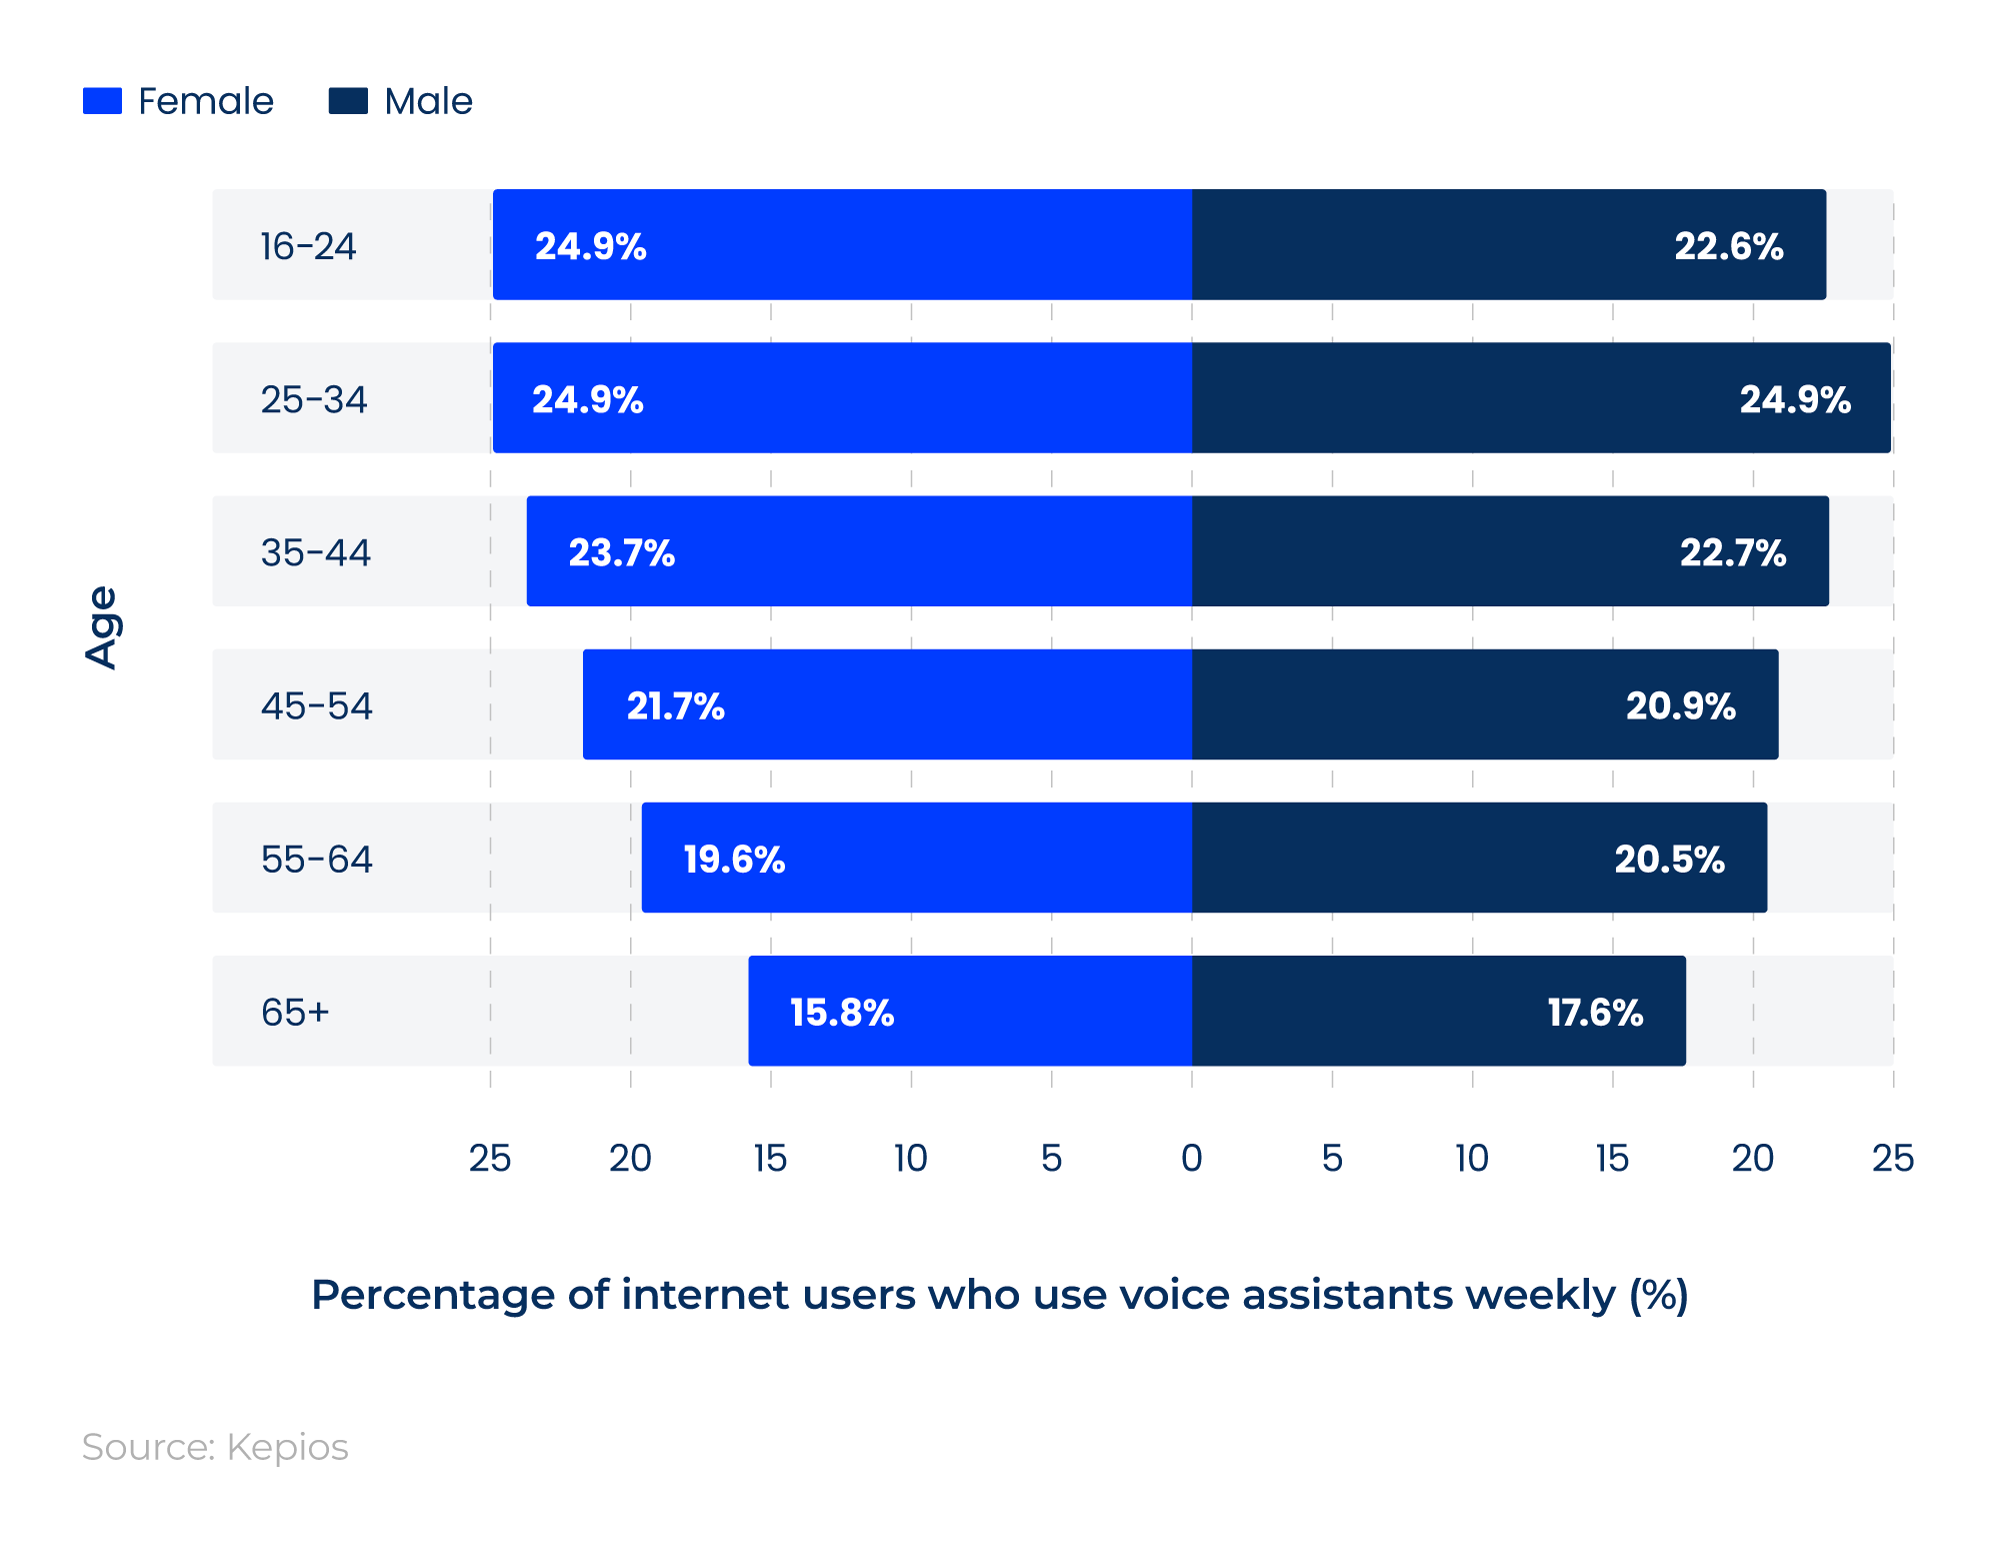
Recent SEO research by Kepios suggests that voice search usage tends to be greater in younger demographics and decreases with age.
Roughly one in four adults aged 25 to 34 use voice search weekly, dropping to 17.6% and 15.8% for males and females aged 65 and above, respectively.
Video SEO statistics
Video SEO statistics for 2026 highlight just how important video is to search engine performance, particularly for user engagement, conversions, and brand awareness.
Findings from Wyzowl show that:
-
93% of video marketers believe video is an important part of their overall business strategy, and 91% use it as a content-marketing tool.
-
92% plan to maintain or increase their video marketing budget.
-
93% say video has helped increase user understanding of their products or services.
-
93% claim it has increased brand awareness.
-
85% have been convinced to buy a product or service after watching a video.
-
80% have chosen to download an app after watching one.
Marketers also say video marketing helps with lead generation: 85% say video has helped generate leads, and 83% say it has directly increased their sales.
Impact of video marketing on sales over time, 2016–26
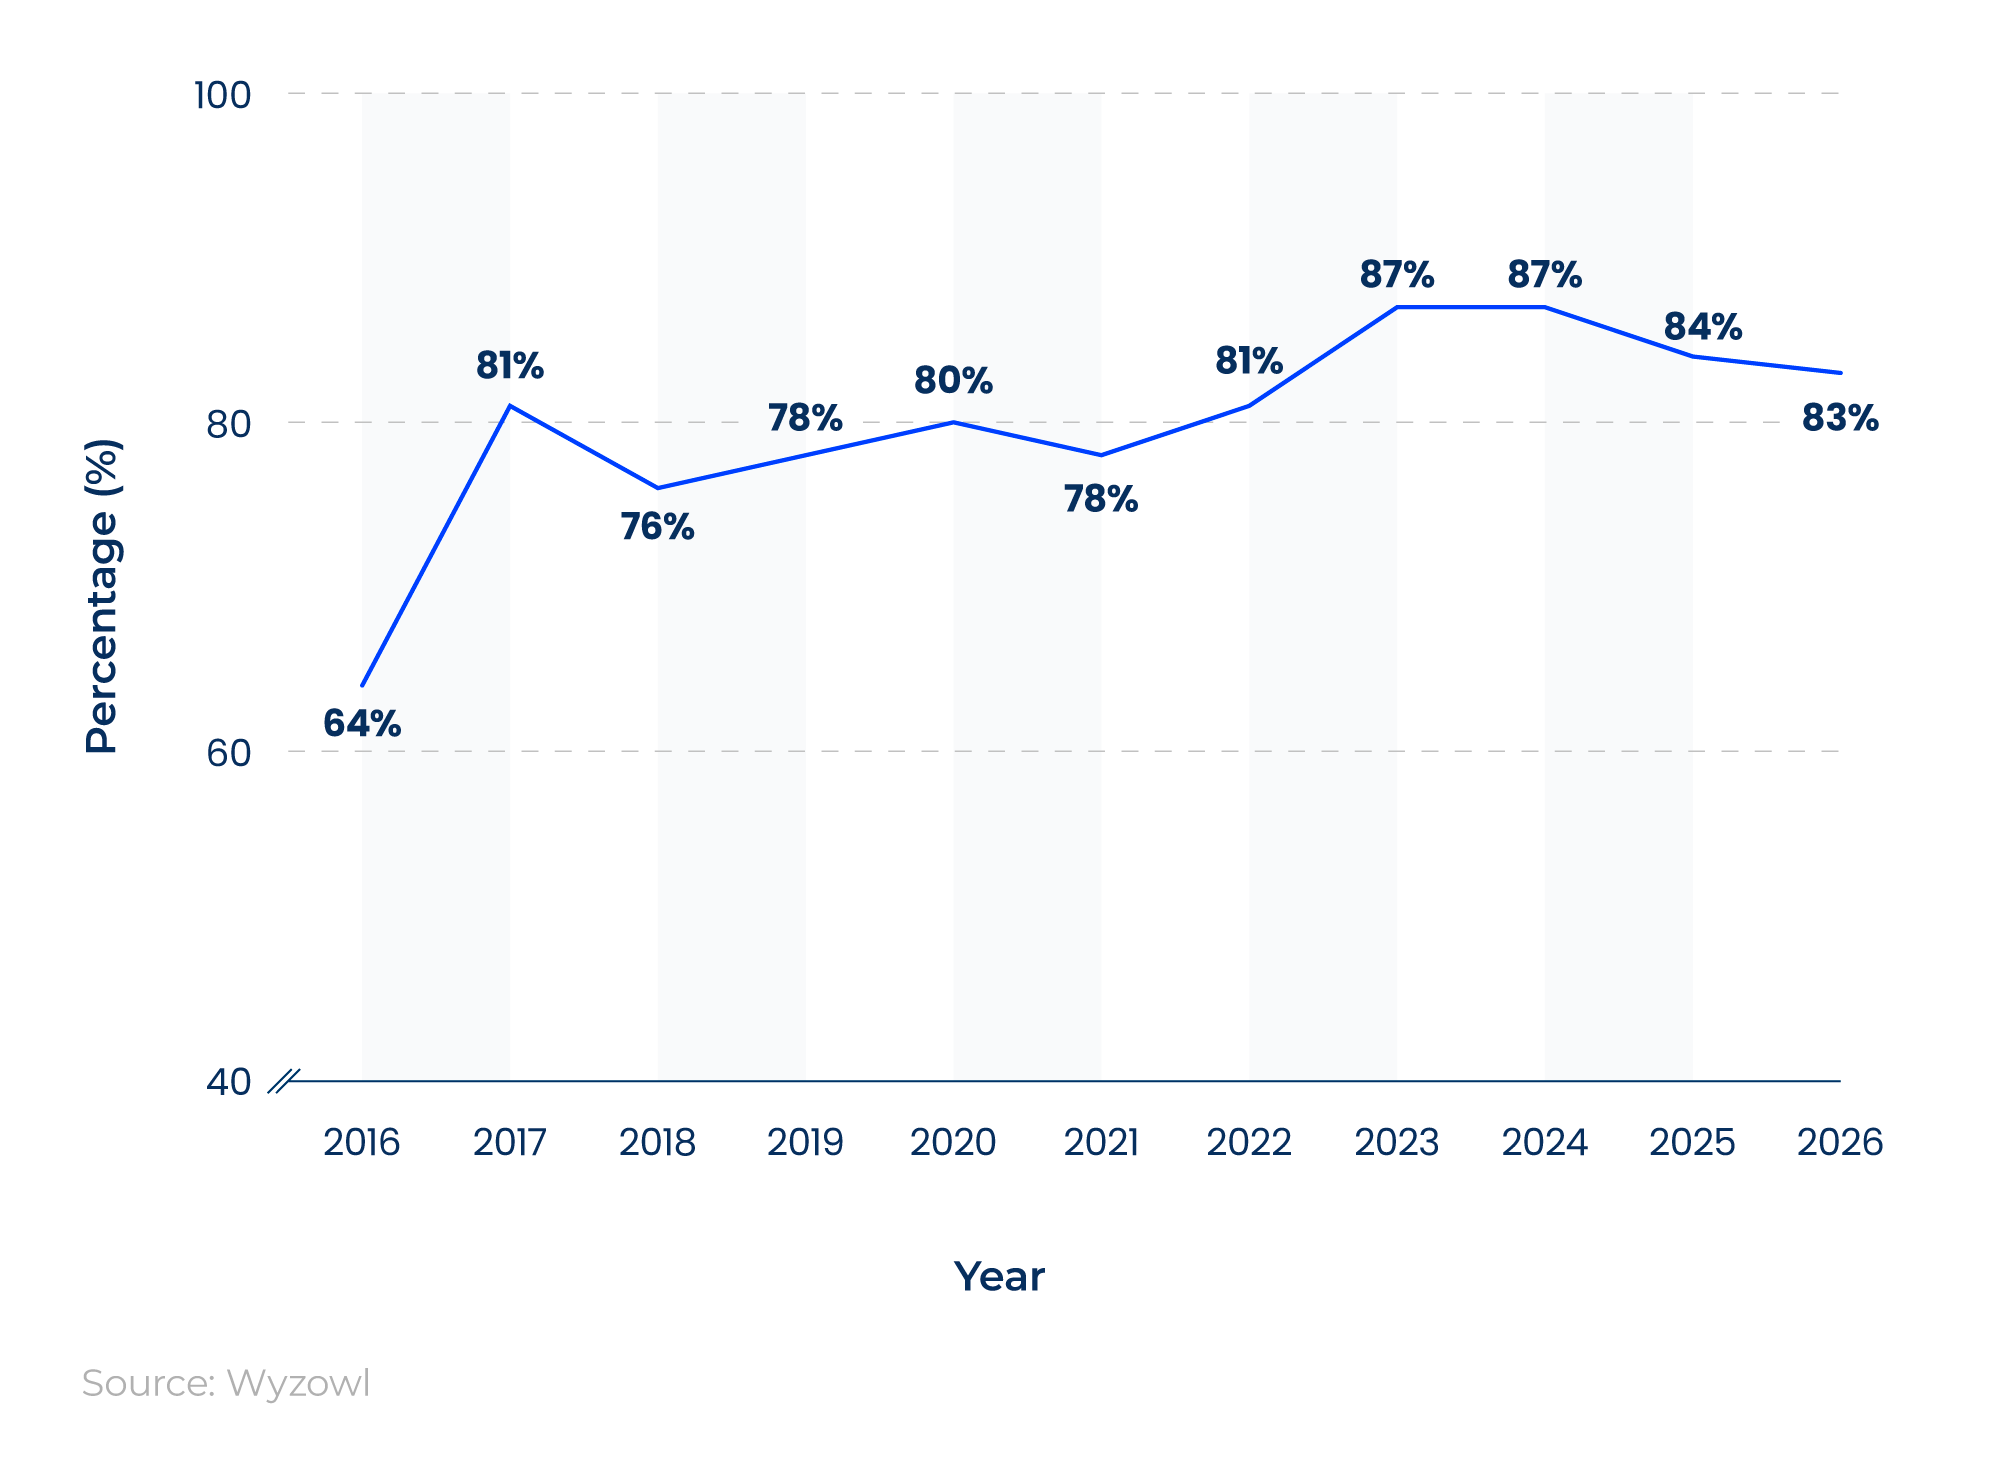
The percentage of video marketers who said that using video has directly increased sales has remained above 80% since 2022, peaking at 87% in 2023 and 2024. This represents a rise of 23 percentage points from 2016, when the figure stood at 64%.
Companies that adopt video marketing also generate about 41% more web traffic from search than those that don’t, while adding a video to a landing page can boost conversion rates by up to 86%.
Video SEO statistics cited by Forbes also show that 26% of search results have a video thumbnail, and mobile users see 12.5 times as many images and three times as many videos in organic search results.
Impact of video marketing on website traffic over time, 2015–26
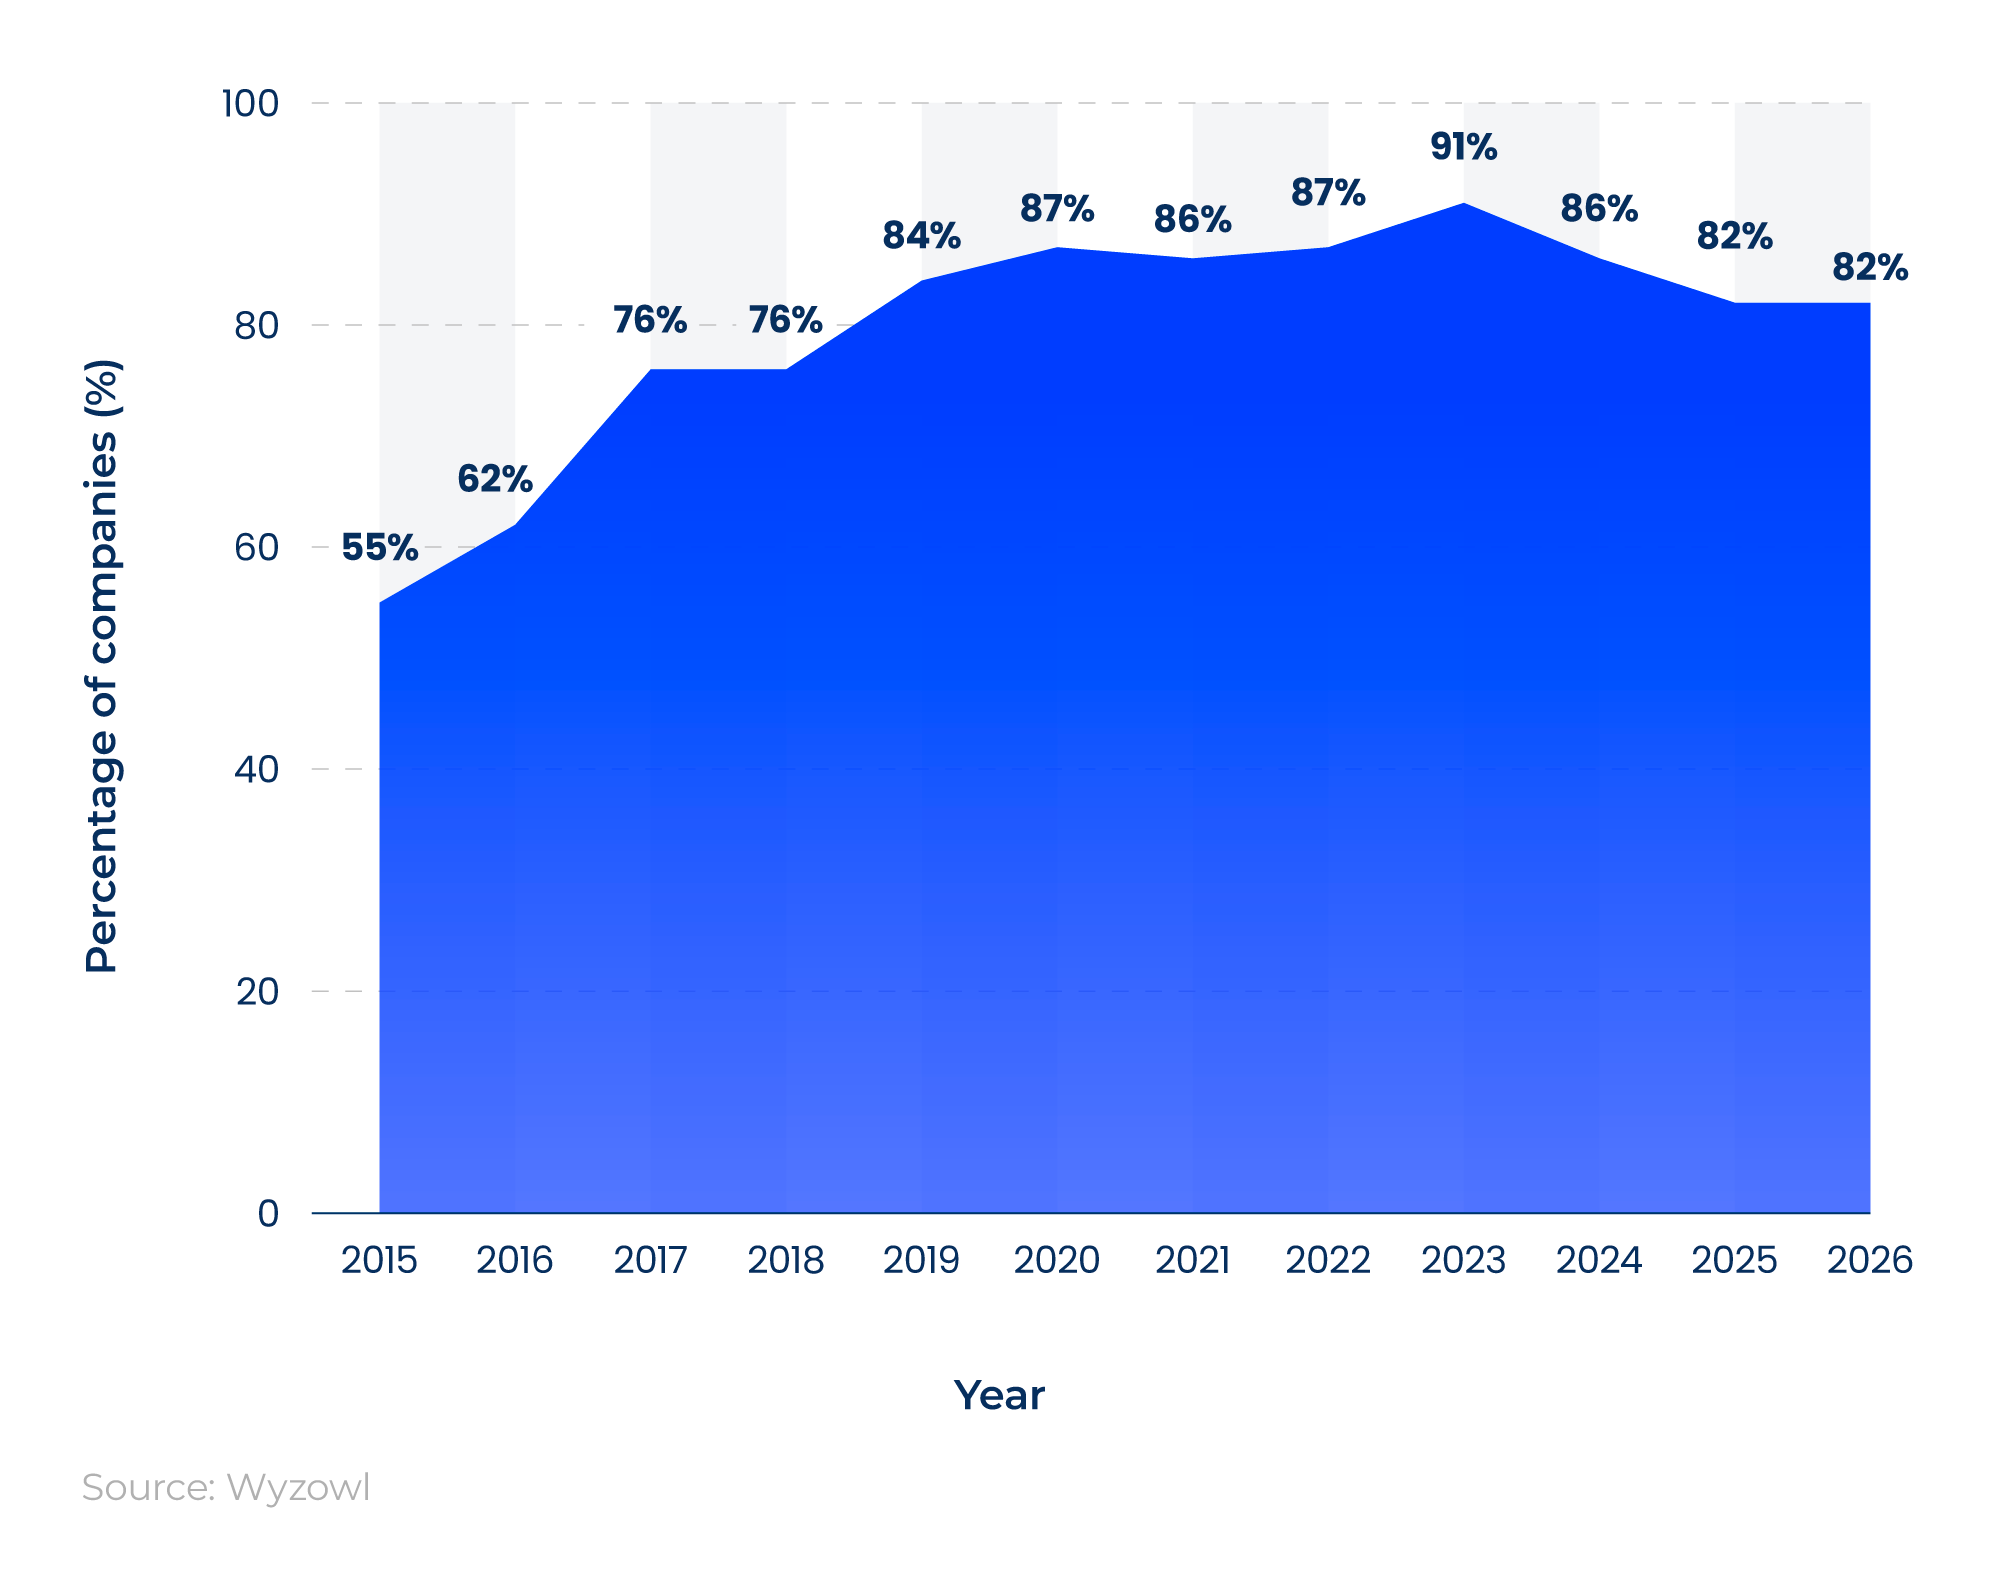
82% of video marketers surveyed by Wyzowl in 2026 say video has helped them increase their site's web traffic. This represents a nine percentage point decrease from the peak of 91% in 2023, but this figure has remained above 80% since 2019.
TABLE 13: Impact of video marketing on business leads over time (2019–26)
|
Year |
Percentage of companies (%) |
|---|---|
|
2019 |
81% |
|
2020 |
83% |
|
2021 |
84% |
|
2022 |
86% |
|
2023 |
90% |
|
2024 |
87% |
|
2025 |
88% |
|
2026 |
85% |
Source: Data from Wyzowl’s Video Marketing Statistics 2026, Section 5: ROI – What does success look like, graph: Increased leads from video
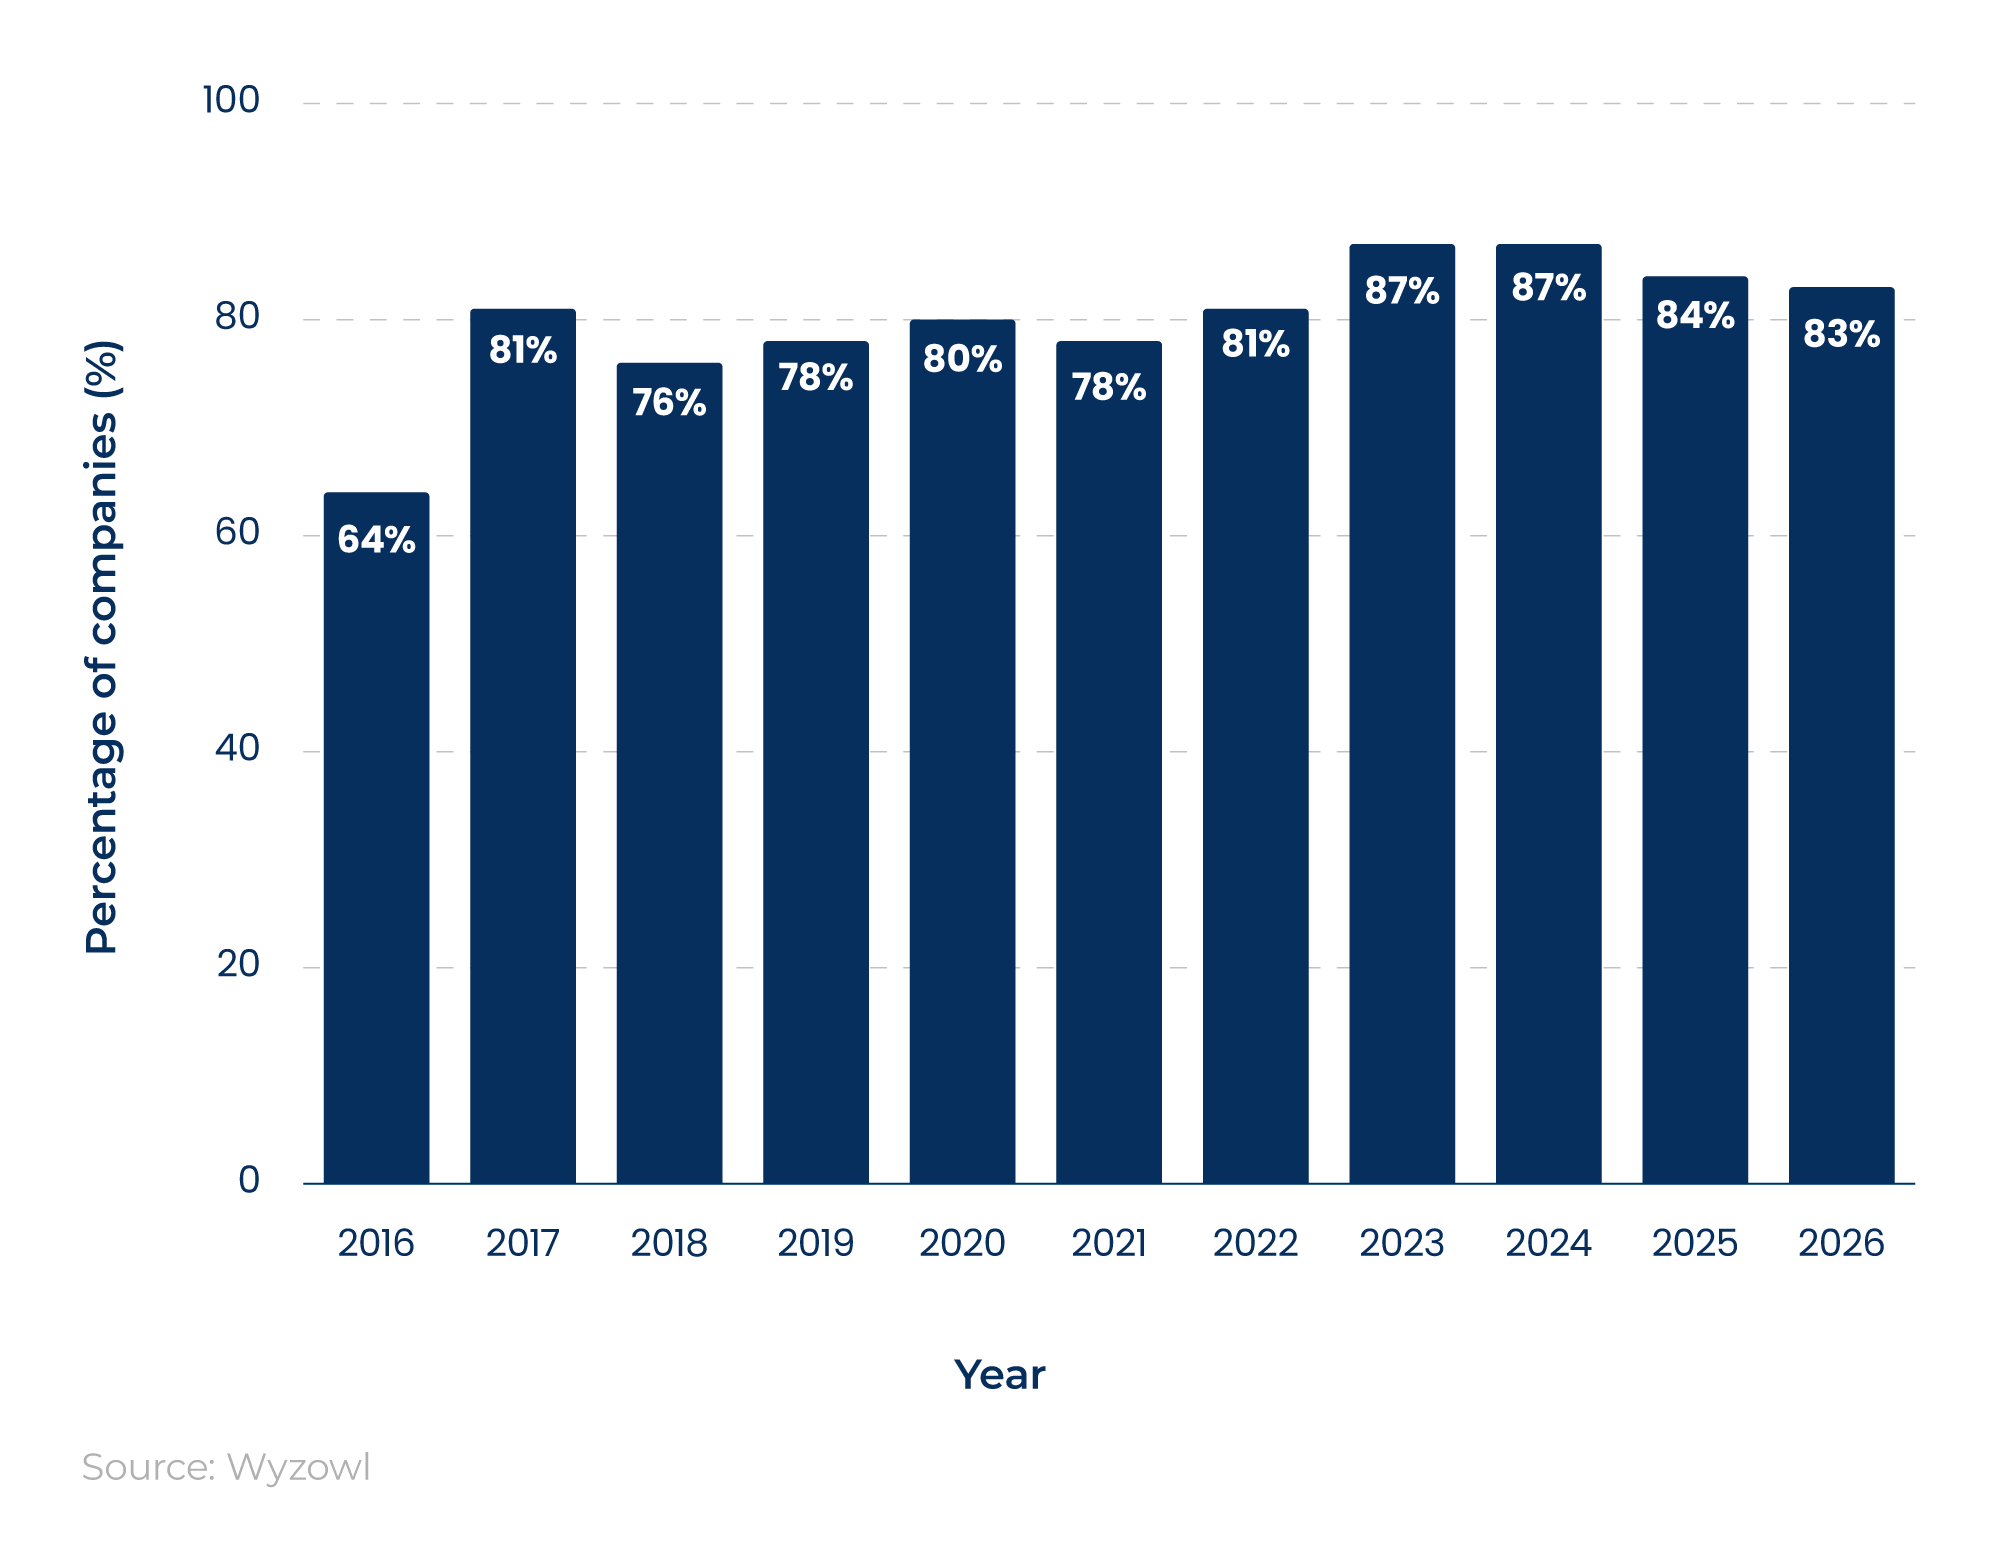
As of 2026, 85% of video marketers claim that using videos has increased the number of business leads.
Despite a five percentage point drop from the 90% peak in 2023, this figure has remained above 80% since 2019.
Impact of video marketing on business sales over time, 2016–26
83% of those surveyed by Wyzowl in 2026 said that video marketing had a positive impact on business sales.
This is four percentage points lower than the high of 87% in 2023 and 2024 and represents a 19 percentage-point rise over 10 years.
Technical SEO statistics
The latest technical SEO statistics show that structured data and rich snippets can positively impact SEO performance.
Impact of structured data and rich snippets on SEO
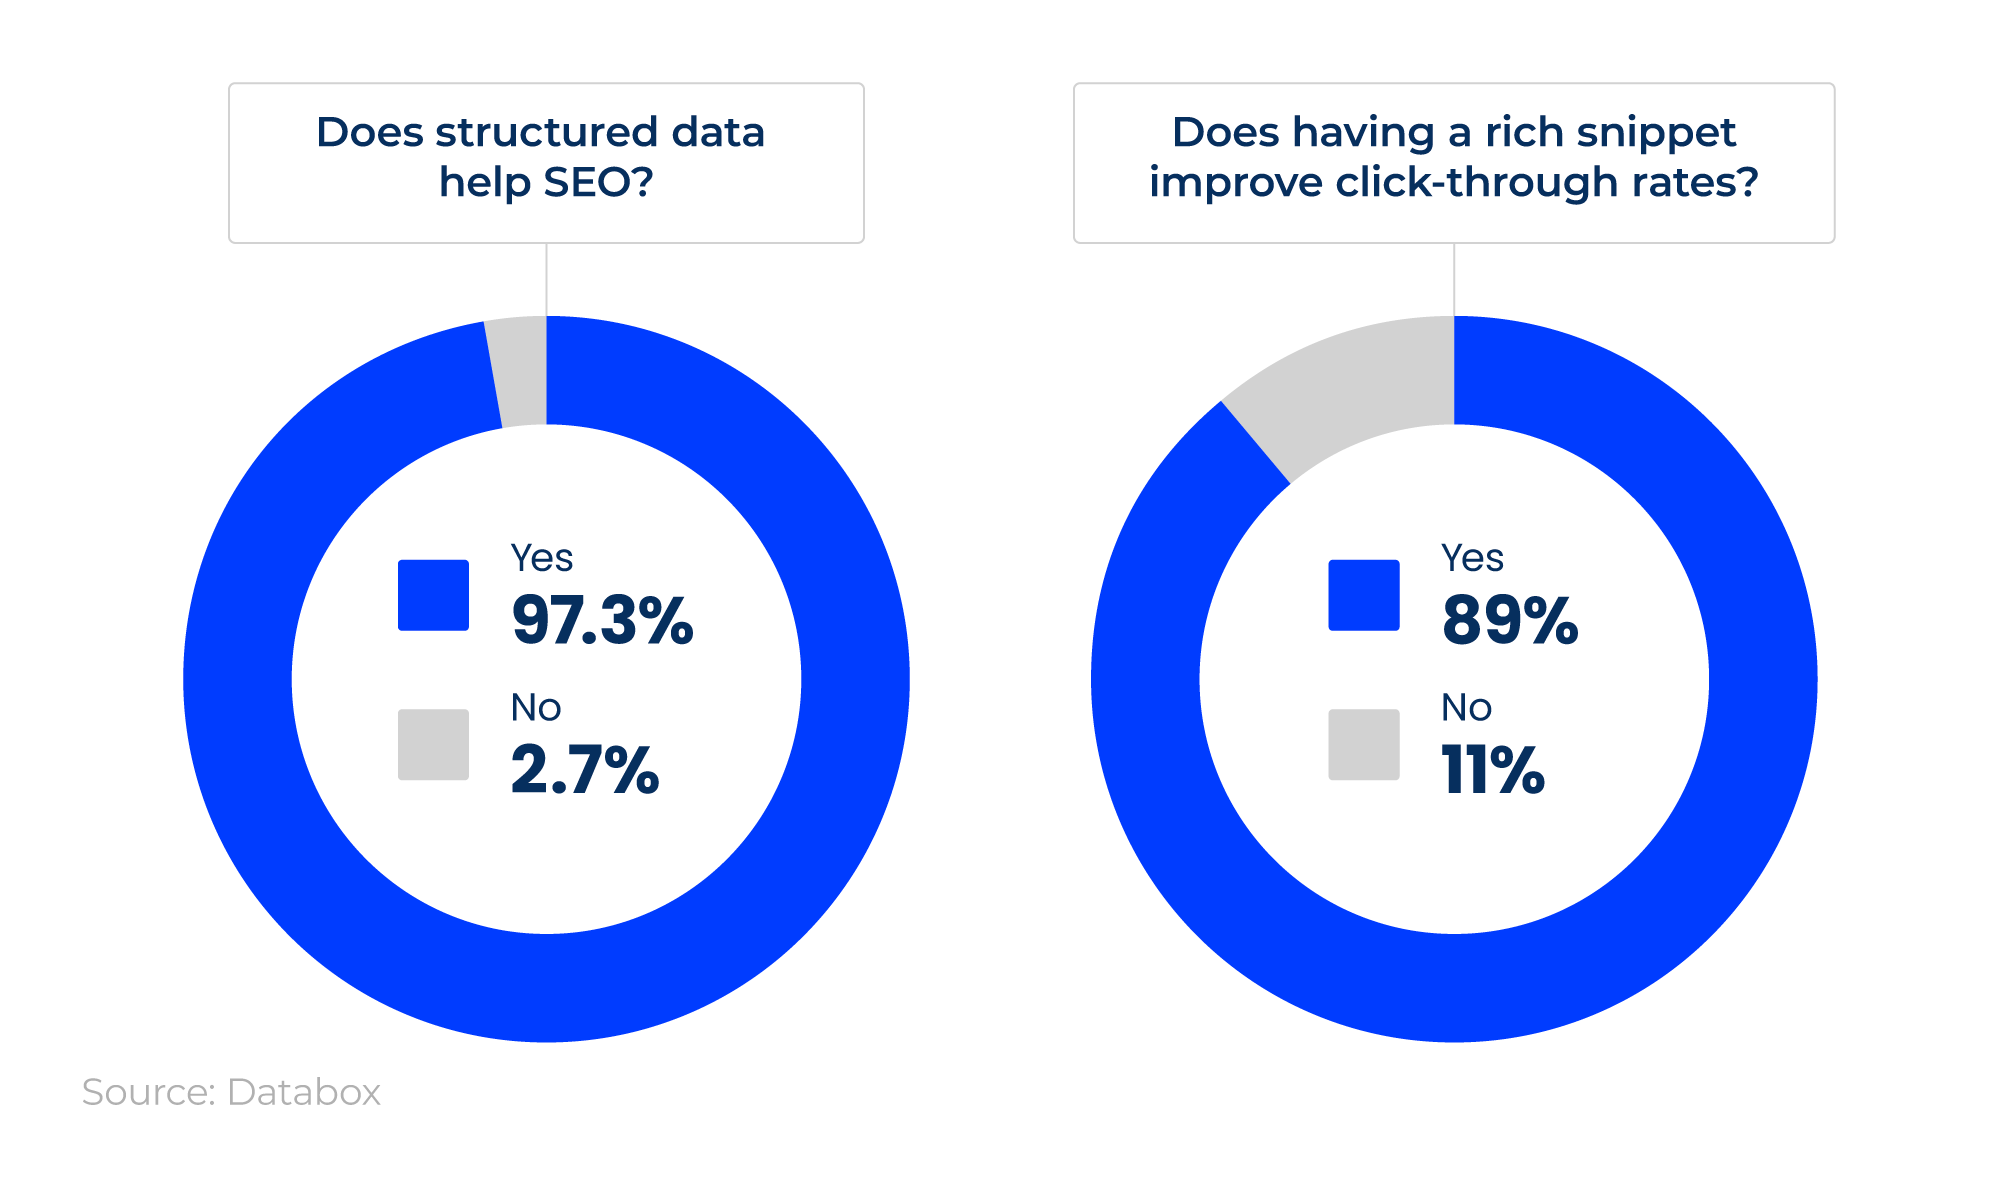
97.3% of SEO professionals interviewed by Databox believe structured data can help with SEO, and 89% say rich snippets can positively impact click-through rates.
The most common technical SEO issues
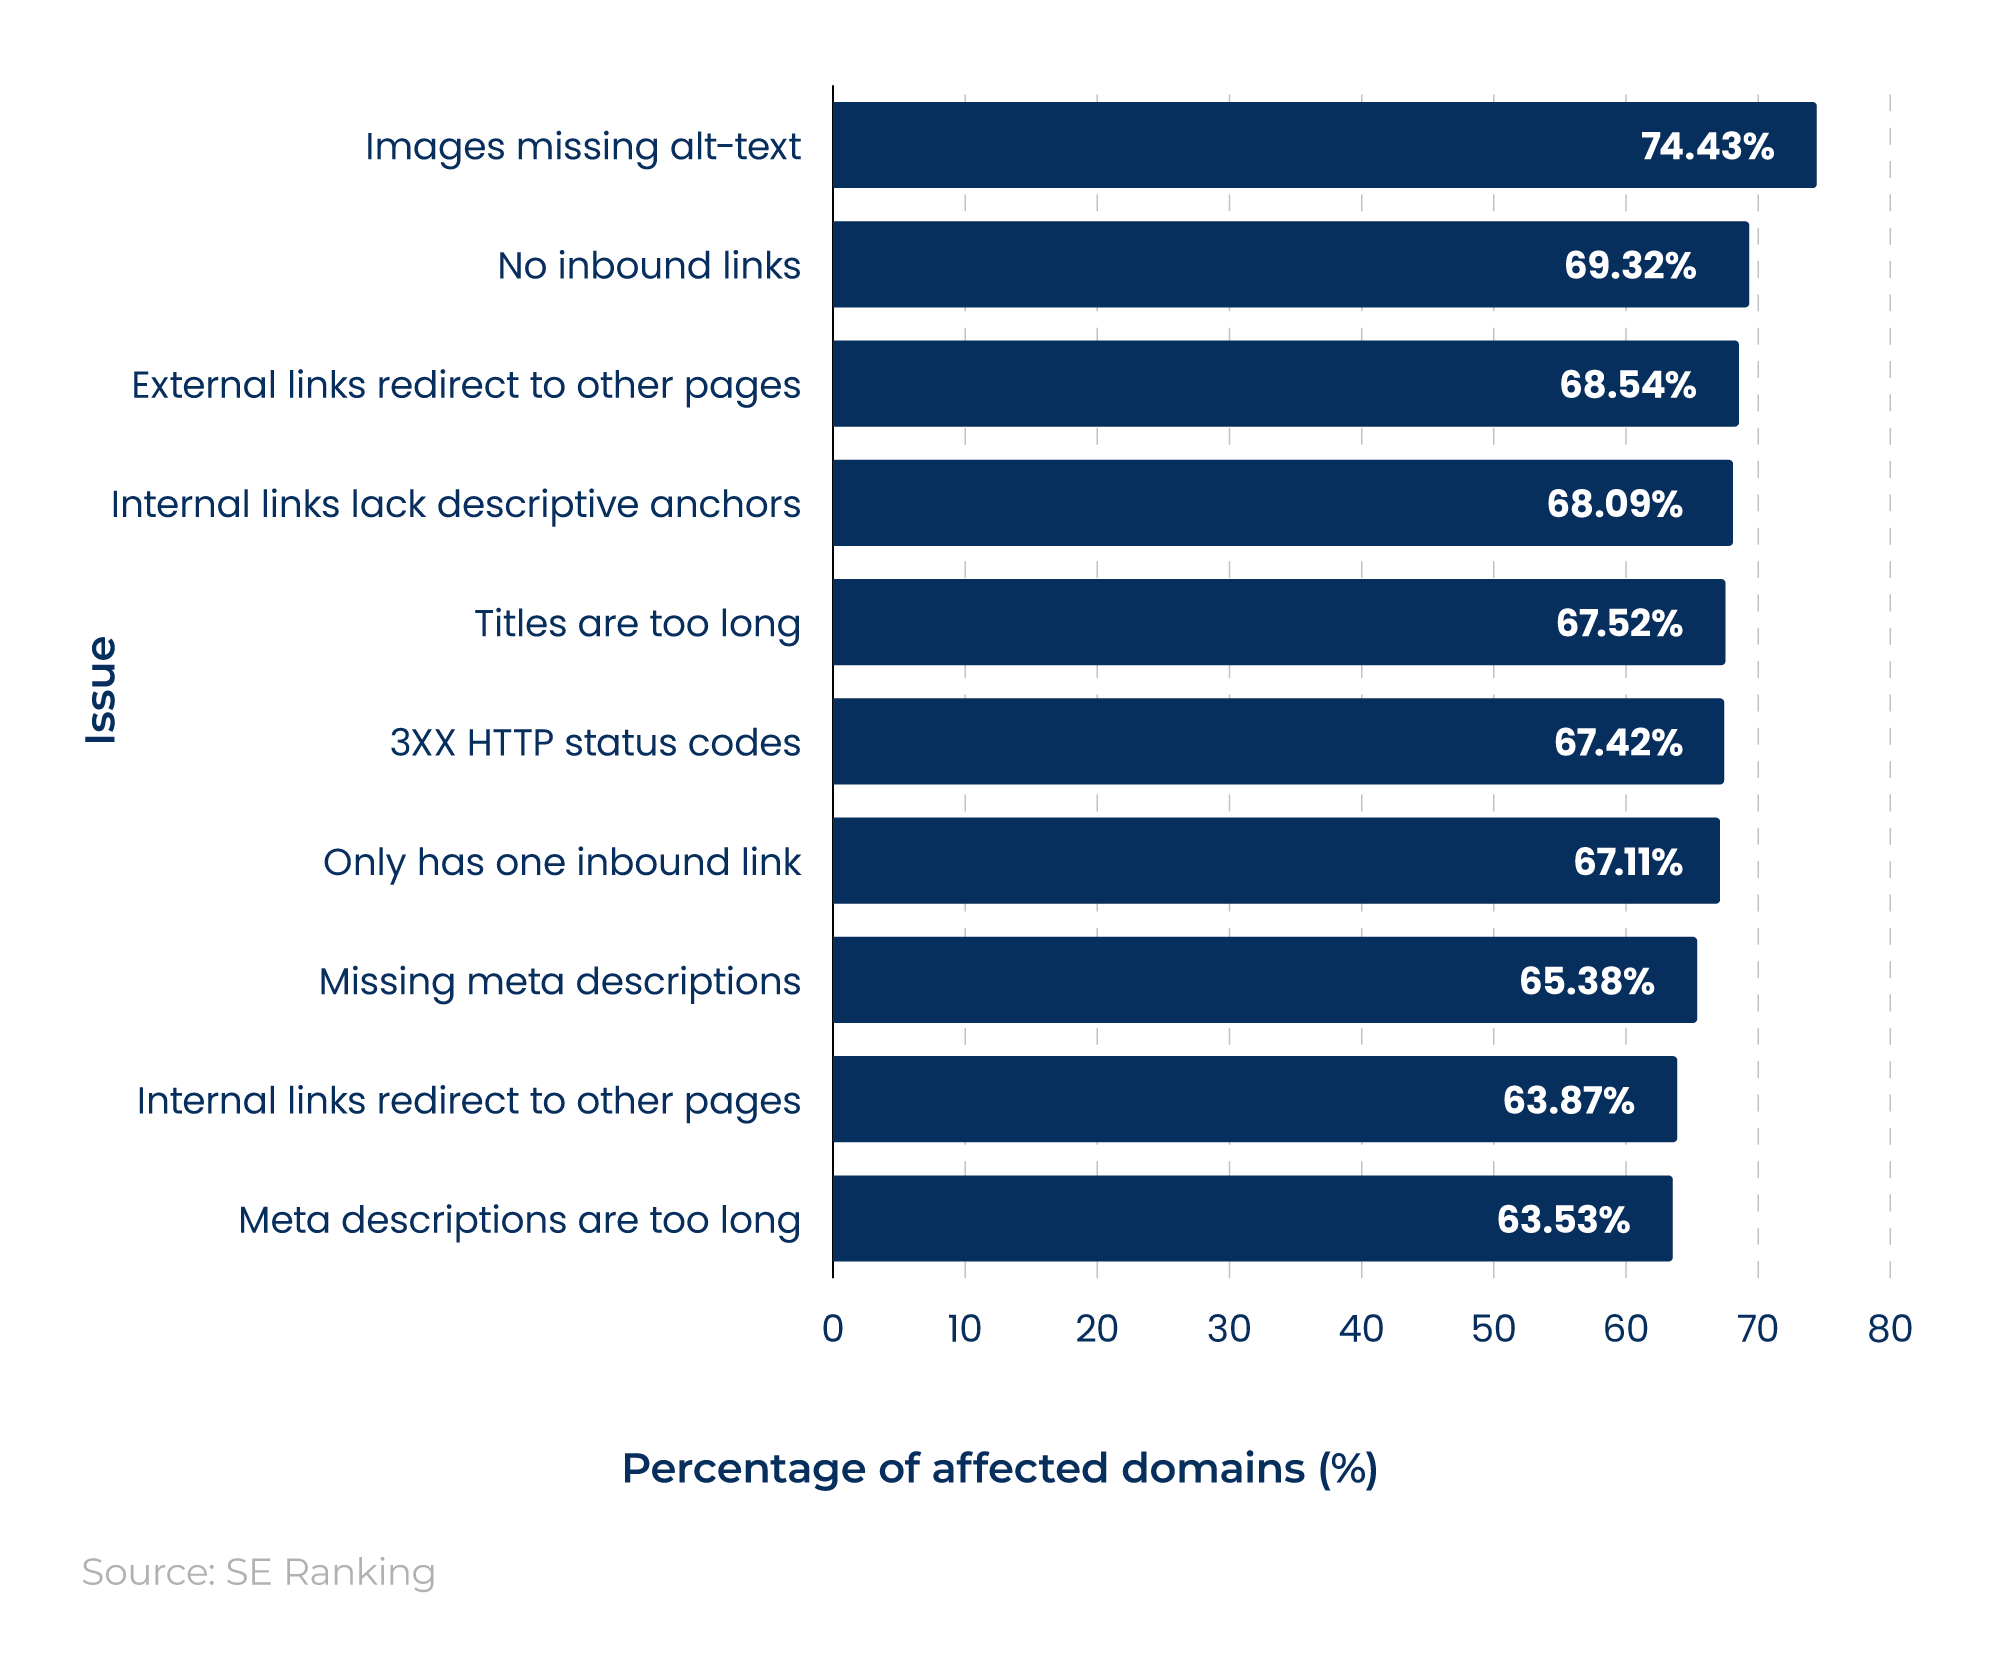
An analysis by SE Ranking of more than 418,000 site audits found that almost three-quarters lacked alt text for images. This made it the most common technical SEO issue in the study.
This was followed by almost seven in 10 having no inbound links, with similar percentages for external links that redirected to other pages, internal links lacking descriptive anchors, and titles that were too long.
TABLE 14: Other common technical SEO issues
|
Issue |
Percentage of affected domains (%) |
|---|---|
|
Duplicate H1 headings |
57.37% |
|
CSS files are too large |
57.72% |
|
Missing H1 headings |
54.67% |
|
External links lack descriptive anchors |
54.58% |
|
Multiple H1 headings |
54.52% |
|
Duplicate titles |
53.69% |
|
Crawling is blocked by noindex |
50.58% |
|
Duplicate meta descriptions |
50.31% |
|
JavaScript files not minified |
50.21% |
|
Titles are too short |
49.36% |
Source: Data from SE Ranking’s 33+ technical SEO issues that affect most websites, Key takeaways
Other common technical SEO issues found were duplicate H1 headings and oversized CSS files, both present in almost six out of 10 site audits.
"Common technical SEO issues collectively introduce meaningful friction for both crawlers and users, suppressing organic performance. While AI has made it easier to produce content at scale, it also forces Google to be more selective about what it indexes and ranks. In this landscape, two key opportunities are still consistently overlooked.
1. Structured data remains one of the most underutilised levers, even among well-established websites. Despite strong industry consensus on its value, implementation is often incomplete, limiting eligibility for rich results and reducing visibility and click-through rates. Its role is only growing in the era of AI and LLM-driven search, where it acts as a machine-readable layer that defines entities, relationships, and context. Schemas such as Organization, LocalBusiness, and Product directly influence how content is interpreted and surfaced.
2. Image optimisation is the second overlooked opportunity. As visual discovery continues to grow, properly implemented alt text and image metadata improve accessibility, indexability, and unlock additional traffic through image search, an increasingly valuable channel.
The basics haven’t changed, but their strategic importance has. Overlooking fundamental tech SEO pillars, structured data, or image optimisation is no longer a minor gap; it’s a missed opportunity across both traditional SEO and AI-driven discovery."
Anna Khlyshch
Local SEO statistics
According to local SEO statistics cited by Forbes, 46% of Google searches are local.
Studies suggest that 42% of local searchers click on the Google Maps Pack, and 18% of local searches lead to a purchase within 24 hours.
Worldwide popularity for the search term ‘near me’, 2014–26
The popularity of the search term ‘near me’ rose between 2014 and 2019, from two to 47 on the Google Trends index score.
Since then, it’s broadly remained between 30 and 50. There are two notable exceptions to this trend:
-
April 2021 to December 2021 – when it stayed above 50 for nine months.
-
February 2026, when it peaked at 100.
Note: Google Trends index score is a relative measure of popularity, not an absolute one. It indicates how popular search terms are, relative to one another (with an index score out of 100), rather than a measure of average monthly search volumes. The closer the number is to 100, the more ‘popular’ that word is in relative terms.
Search engine statistics
Search engine market share statistics
As of March 2026, Google had a search engine market share of 89.85%, followed by Bing with 5.13%. This means Google is around 18 times more prominent than Bing in the global search engine market.
Search engine market share by devices, March 2026
When broken down by device type, Google’s search engine market share on mobile devices is around 12 percentage points higher than on desktops (95.2% vs 83.19%, respectively).
Conversely, Bing’s market share is more than 10 times higher on desktops than on mobiles (10.45% vs 0.68%, respectively).
Search engine market share over time across all devices, 2017–26
Since 2017, Google’s search engine market share has remained around 90%, peaking at 92.63% in 2019.
During this time, Bing’s search engine market share almost doubled from 2.44% in 2019 to 4.85% in 2026, with YANDEX’s market share nearly quadrupling from 0.39% to 1.52%.
TABLE 15: Search engine market share over time across desktop devices, 2017–26
|
Date |
Google (%) |
Bing (%) |
YANDEX (%) |
Yahoo! (%) |
DuckDuckGo (%) |
Other (%) |
|---|---|---|---|---|---|---|
|
2017 |
87.75 |
5.11 |
0.64 |
3.48 |
0.3 |
2.72 |
|
2018 |
87.76 |
5.48 |
0.35 |
3.12 |
0.38 |
2.91 |
|
2019 |
88.44 |
4.89 |
0.42 |
3.00 |
0.50 |
2.75 |
|
2020 |
86.95 |
6.14 |
0.46 |
2.86 |
0.64 |
2.95 |
|
2021 |
86.61 |
6.45 |
0.95 |
2.76 |
0.89 |
2.34 |
|
2022 |
84.71 |
8.65 |
1.33 |
2.61 |
0.93 |
1.77 |
|
2023 |
84.43 |
8.67 |
1.88 |
2.57 |
0.72 |
1.73 |
|
2024 |
80.53 |
11.32 |
2.47 |
2.91 |
0.80 |
1.97 |
|
2025 |
80.69 |
11.20 |
2.59 |
2.84 |
0.99 |
1.69 |
|
2026 |
82.98 |
10.45 |
1.74 |
2.66 |
0.80 |
1.37 |
Source: Data collected by Reboot Online via Statcounter, Desktop Search Engine Market Share Worldwide 2017–2026
Google’s search engine market share across desktop devices fluctuated between 2017 and 2026, from a high of 88.44% in 2019 to a low of 80.53% in 2024.
Bing’s market share on global desktop devices more than doubled between 2017 and 2026, from 5.11% to 10.45%, to remain as the second-largest search engine on the market.
TABLE 16: Search engine market share over time across mobile devices, 2017–26
|
Date |
Google (%) |
Bing (%) |
YANDEX (%) |
Yahoo! (%) |
DuckDuckGo (%) |
Other (%) |
|---|---|---|---|---|---|---|
|
2017 |
95.21 |
0.96 |
0.23 |
1.07 |
0.08 |
2.45 |
|
2018 |
94.13 |
0.77 |
0.24 |
1.36 |
0.19 |
3.31 |
|
2019 |
95.4 |
0.78 |
0.39 |
1.01 |
0.33 |
2.09 |
|
2020 |
95.28 |
0.48 |
0.69 |
0.87 |
0.38 |
2.30 |
|
2021 |
94.85 |
0.47 |
0.86 |
0.84 |
0.47 |
2.51 |
|
2022 |
95.60 |
0.55 |
0.96 |
0.77 |
0.51 |
1.61 |
|
2023 |
95.74 |
0.50 |
1.16 |
0.57 |
0.46 |
1.57 |
|
2024 |
94.69 |
0.68 |
1.74 |
0.56 |
0.54 |
1.79 |
|
2025 |
94.17 |
0.66 |
2.06 |
0.72 |
0.75 |
1.64 |
|
2026 |
94.95 |
0.68 |
1.38 |
0.55 |
0.71 |
1.73 |
Source: Data collected by Reboot Online via Statcounter, Mobile Search Engine Market Share Worldwide 2017–2026
Google’s dominance in the global mobile search engine market has remained high for many years, fluctuating around 95% since 2017.
Historically, the second spot was typically fought between Bing and Yahoo!, yet it very rarely exceeded 1% of the overall market.
Since 2023, YANDEX’s search engine market share has remained above 1%, making it the second-largest search engine globally for mobile devices.
Search engine marketing statistics
As of October 2025, an estimated 6.04 billion people used the internet. This equates to approximately 73.2% of the global population and represents a year-on-year (YoY) increase of 5.1%.
Findings from Kepios also show:
-
A small gender digital divide, with 75.7% of males and 70.7% of females using the internet globally.
-
The average time spent by internet users consuming online media is 33 hours and 27 minutes.
-
96% of global internet users do so on their mobile devices, vs 59.6% on laptops and desktops.
-
86.5% of people in urban areas use the internet, compared with 54.5% in rural areas.
Main reasons for using the internet
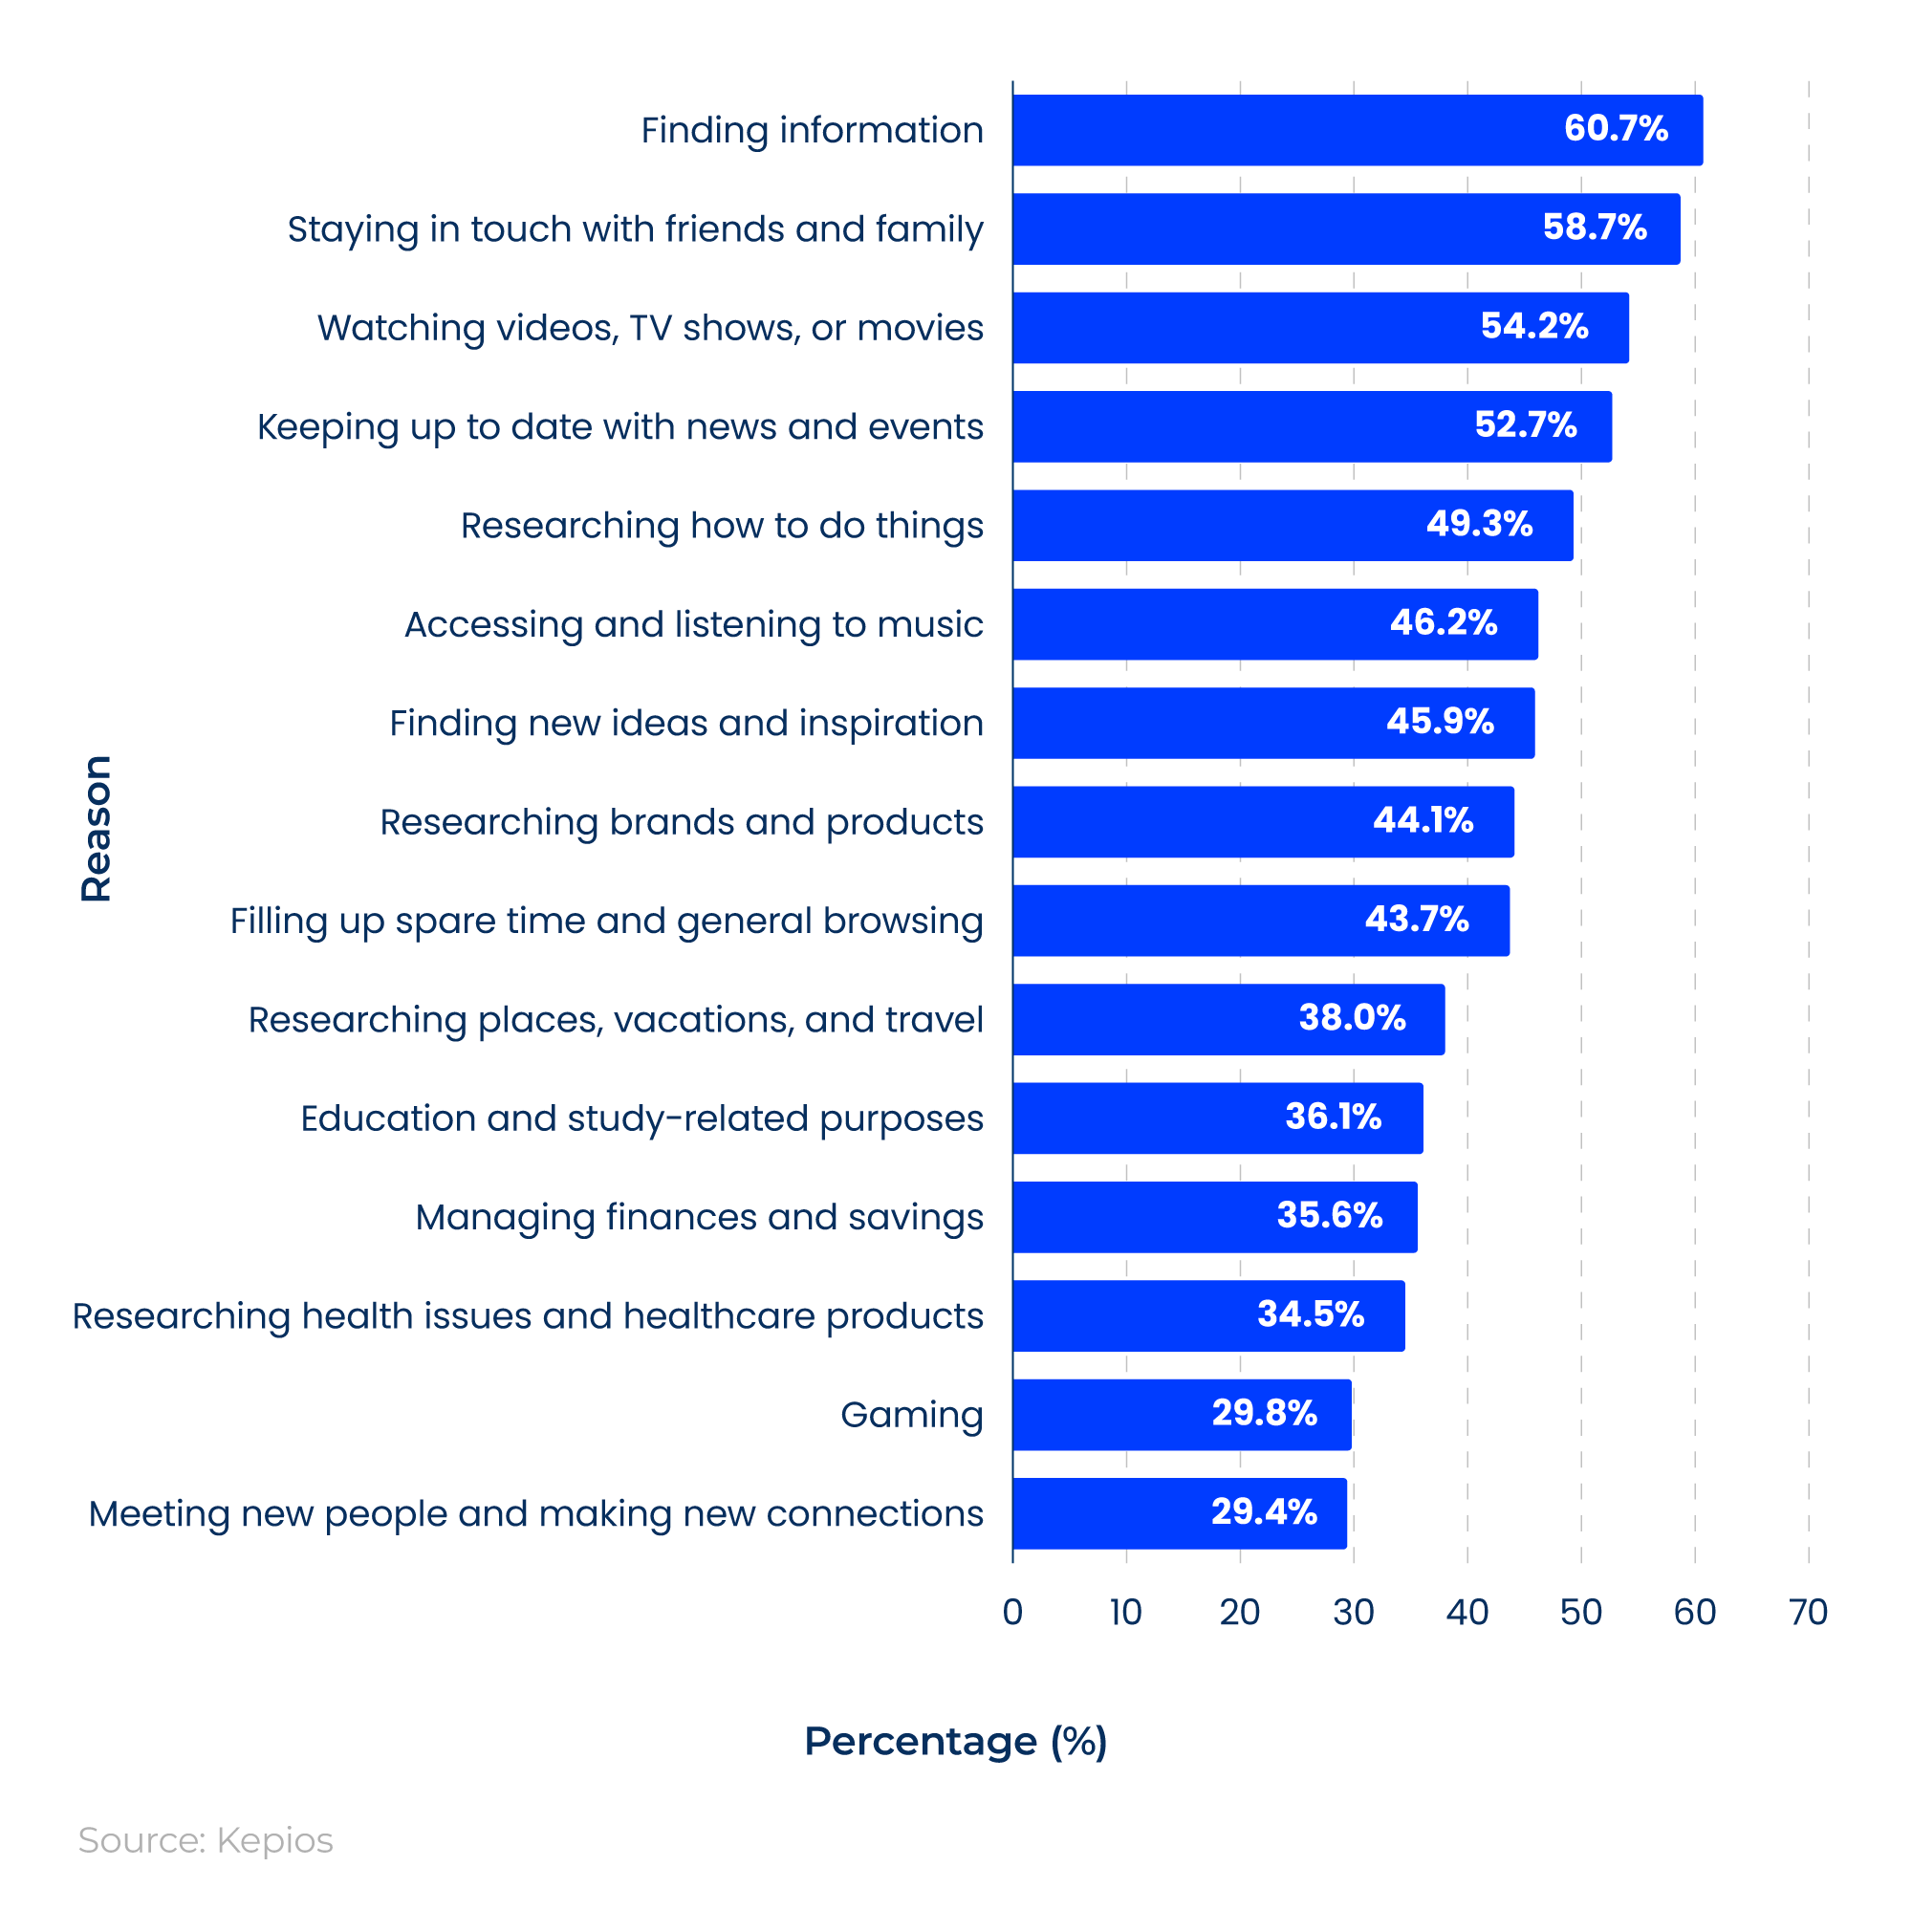
Roughly three in five people surveyed by Kepios use the internet to find information, with a similar proportion using it to stay in touch with friends and family.
More than half use the web to watch videos, TV shows, or movies and keep up to date with news and events, compared to fewer than three in 10 who use it for gaming and meeting new people.
Google statistics
Google handles over 158,000 search queries every second. This equates to more than 13.7 billion searches per day, or more than five trillion a year.
The average Google user performs around four searches a day, with the median at 1.8 or more than half of this.
Cumulatively, more than a billion of these searches are for shopping, with two-thirds of purchases involving a new brand, product, or retailer being made through Google or YouTube.
Google’s Search Index covers hundreds of billions of web pages and is more than 100 million gigabytes in size.
All of this means that, if your website is not optimised for organic Google Search, then your target audience will struggle to find your brand when searching online. This could reduce online visibility, poor click-through rates and conversions, and ultimately lead to fewer sales and lower revenue.
Did you know?
Google has more than 200 factors that determine its search engine rankings.
Alphabet (Google) annual revenue ($bn) over time, 2011–25
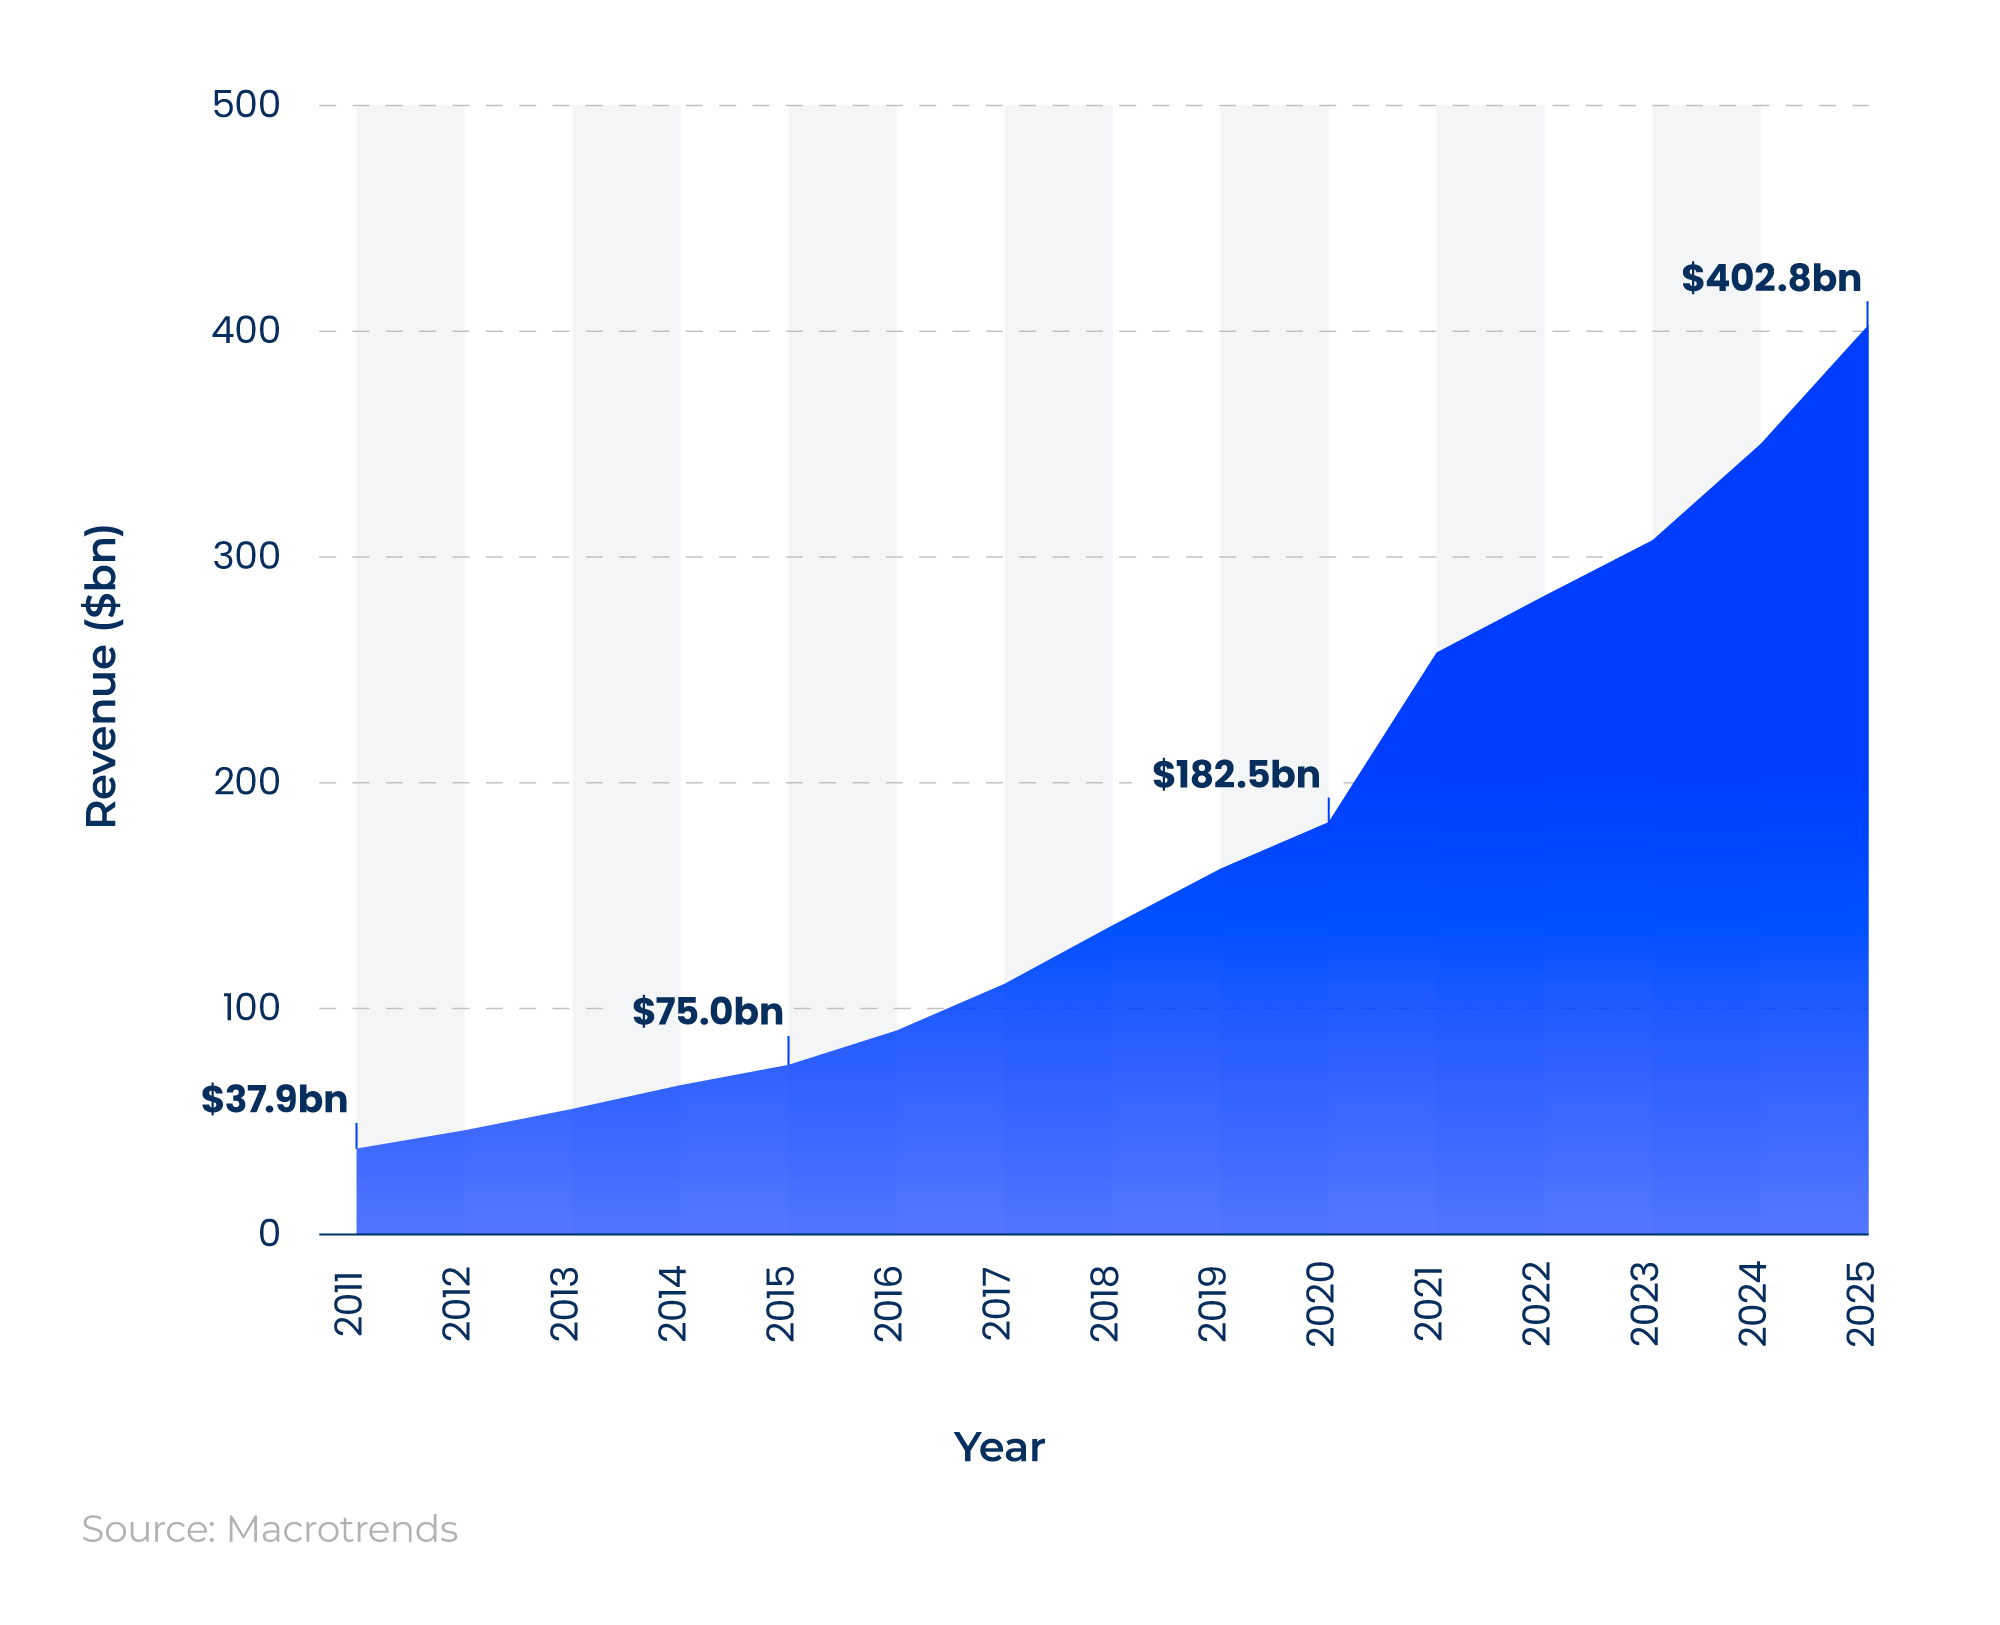
Note: Alphabet was formed in 2015; prior to this, it operated as Google Inc.
Alphabet (Google) reported annual revenue of approximately $402.8 billion in 2025. This represented an increase of 15.1% from 2024 and more than double compared to 2020 figures.
Number of Google updates over time, 2003–26
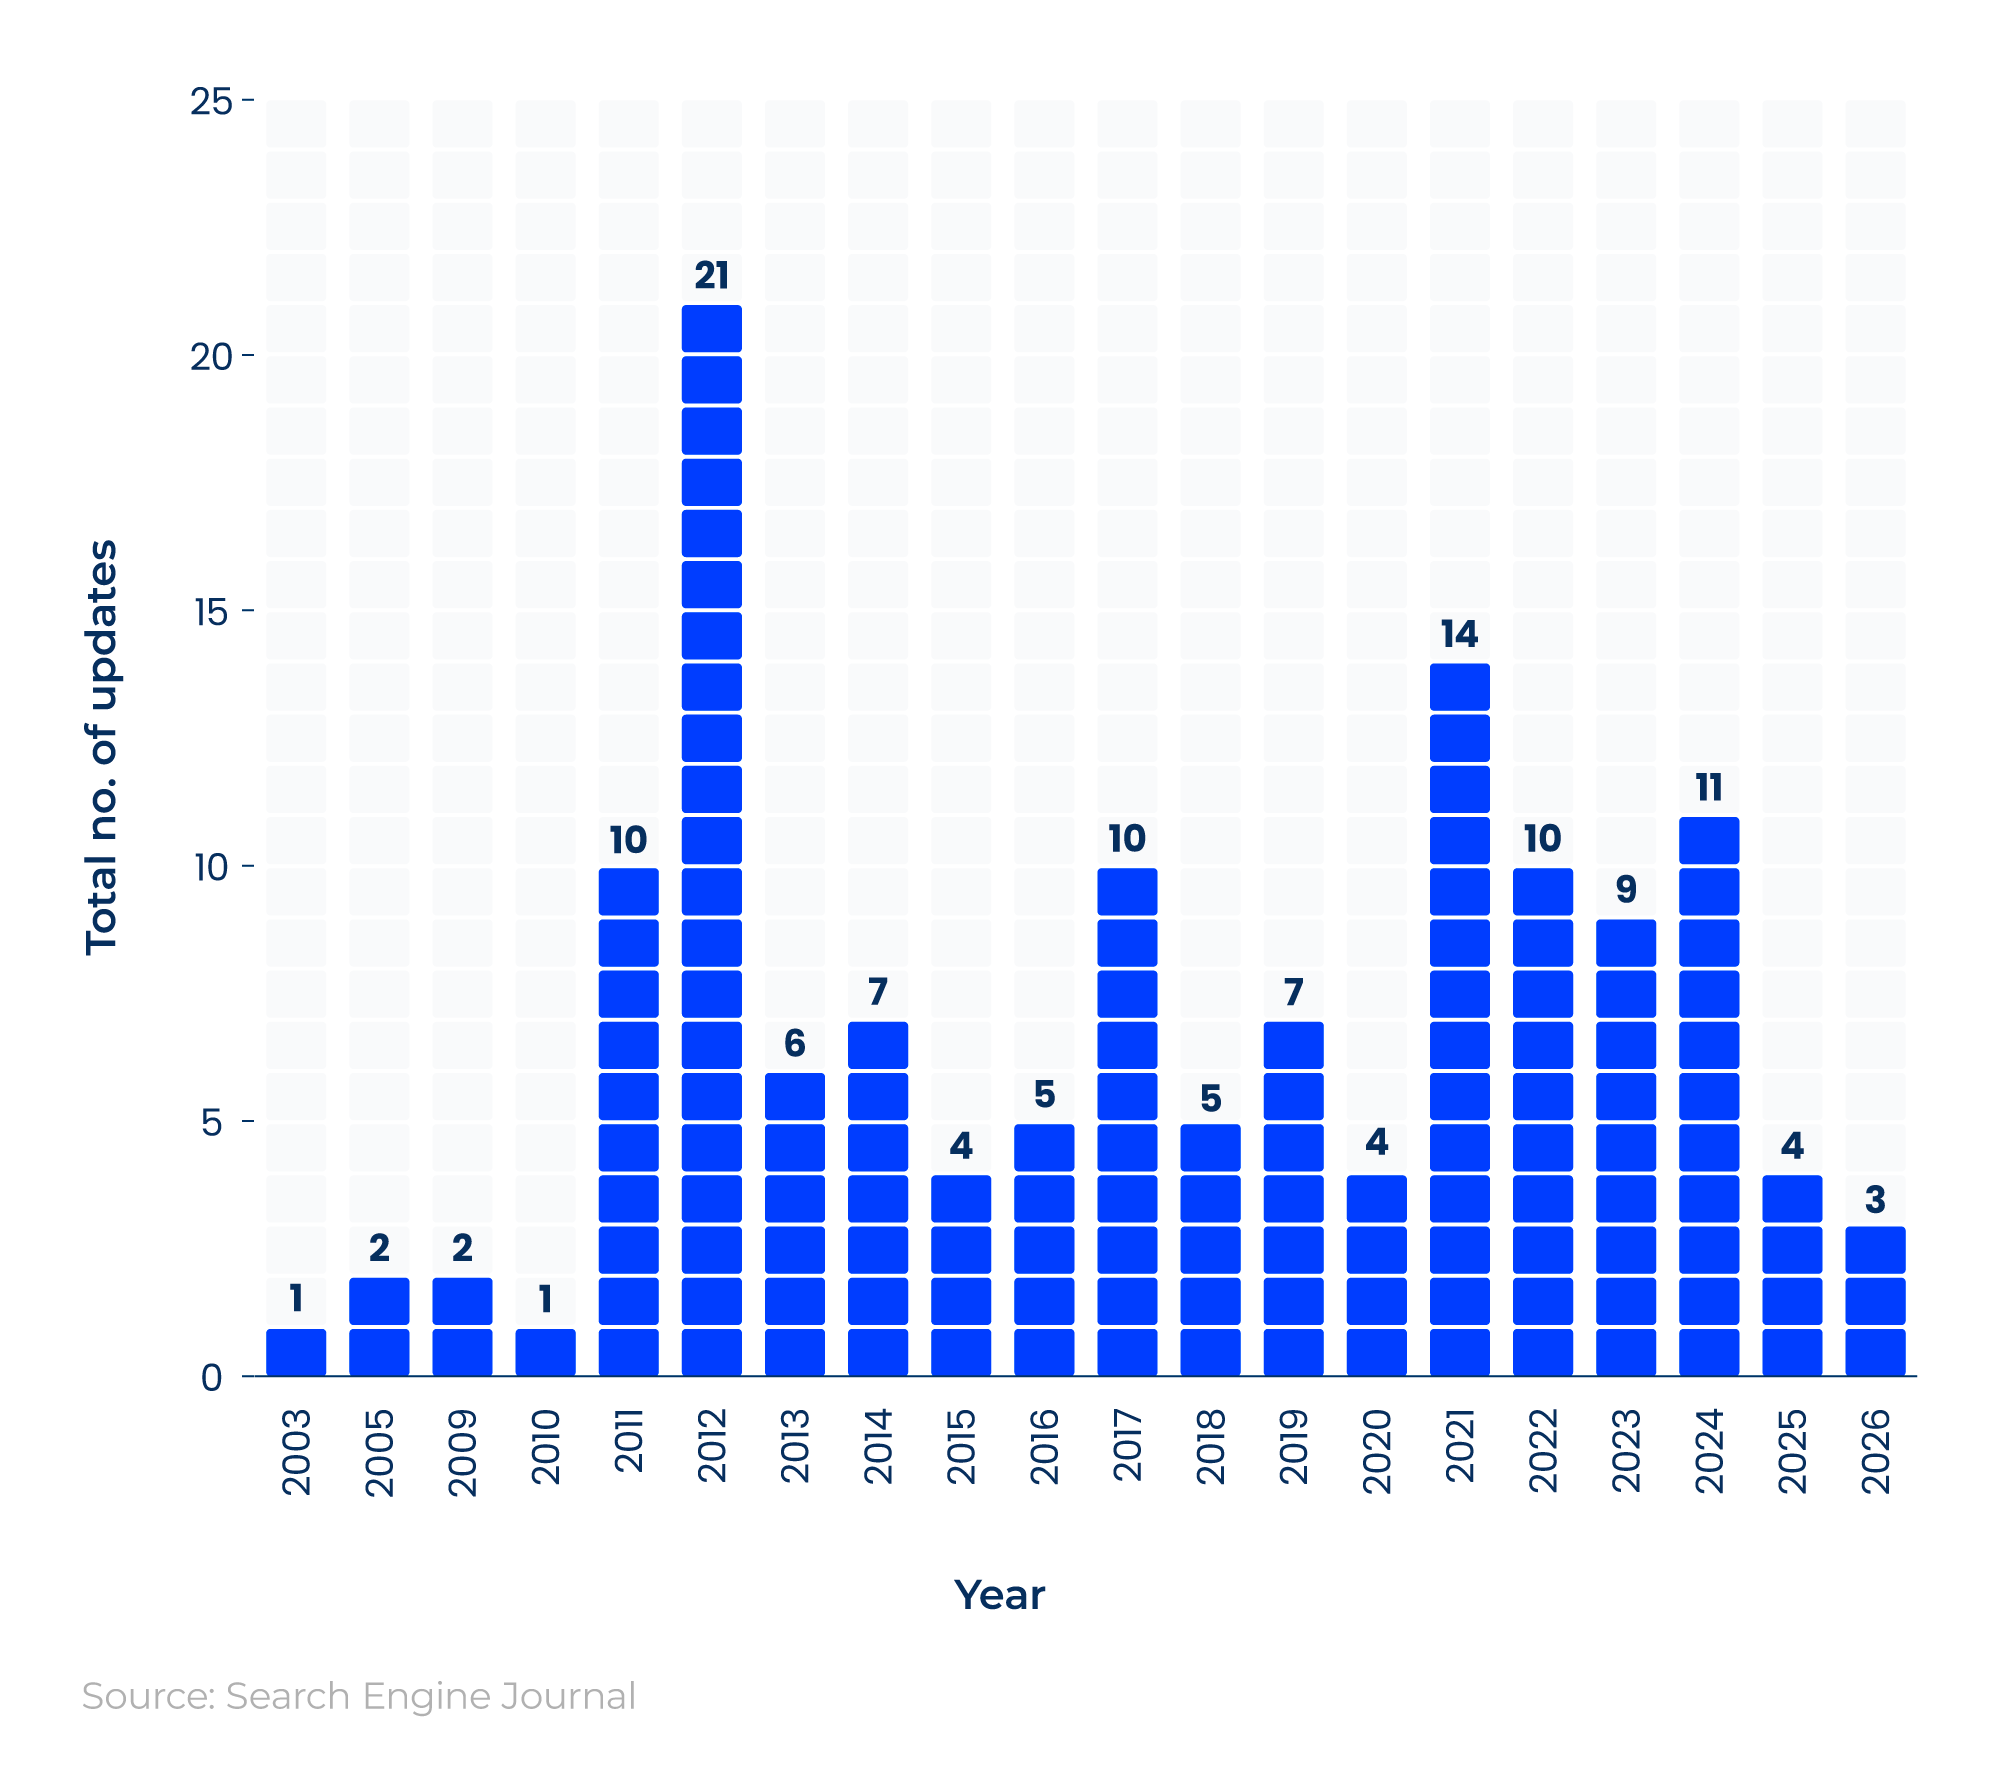
Google had 136 updates (and counting) between 2003 and Q1 2026. On average, this works out to just under seven updates a year.
Around 15% of these came in 2012, when 21 Google updates took place (the most across all years during this period).
Google SEO statistics
According to Google SEO statistics cited by Forbes:
-
Google rewrites 61% of meta titles and 62.78% of meta descriptions.
-
The most common type of featured snippets is paragraphs (70%), with videos accounting for only 4.6%.
-
The average age of top search results is 2.6 years.
Studies by Backlinko also found that 23% of Google searchers use autocomplete suggestions (based on search history, location, and what you’ve already typed in as part of your search).
This suggests that, if you want to be successful and rank on Google, then you need to be patient and play the long game. Your pages’ metadata should be targeted to the right keywords and, ideally, answer questions to boost your chances of gaining a featured snippet.
Organic search traffic statistics
SEO industry analysis by SharkPlatform found that more than half of web traffic comes from organic search.
Most common sources of web traffic
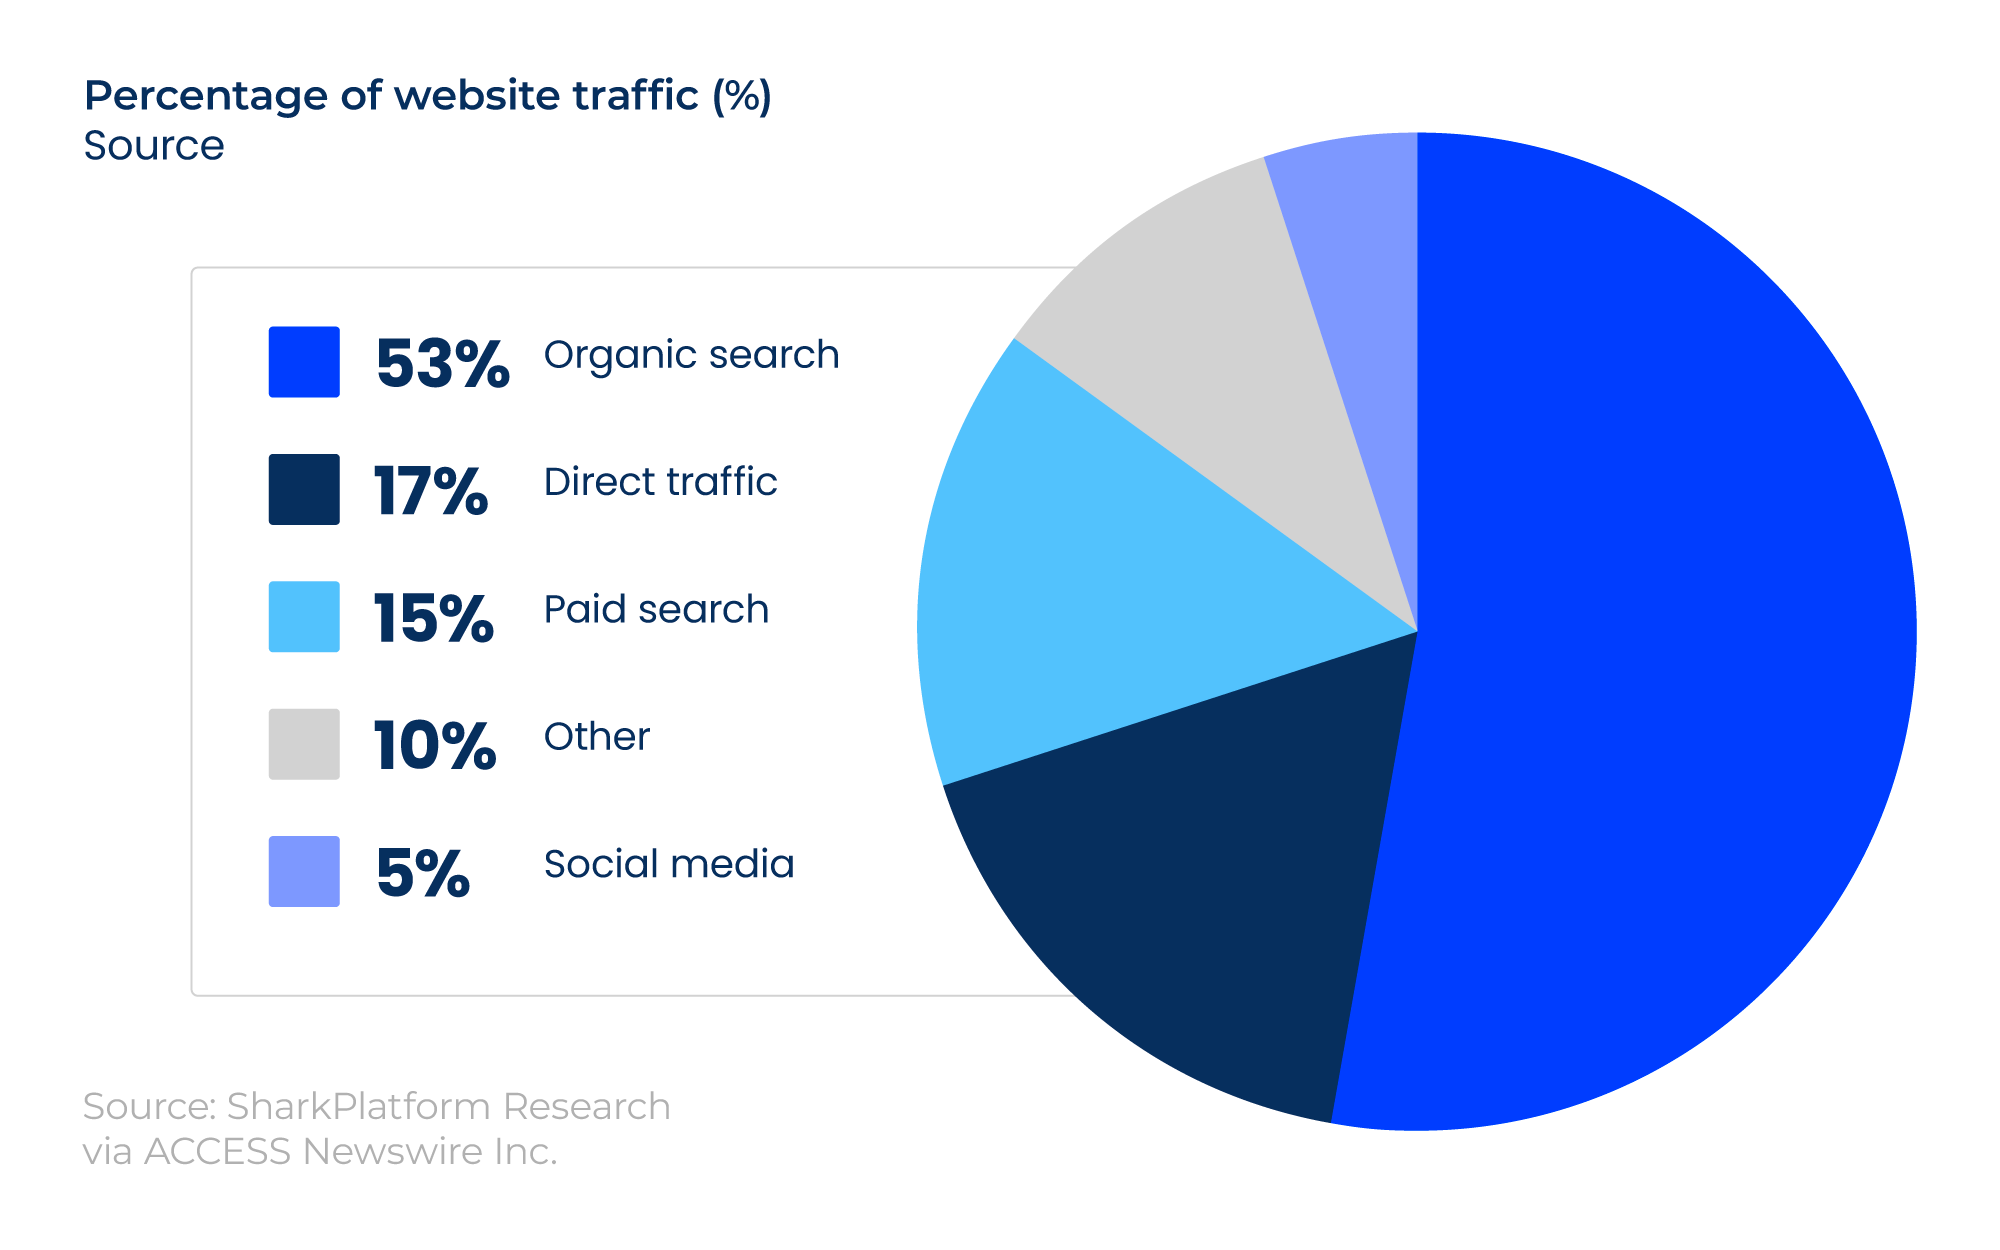
This is contrasted with around a sixth from both direct traffic and paid search (17% vs 15%, respectively).
Findings also show that organic search can generate more than 60% of inbound leads in some industries, with organic search traffic around 10 times that from social media.
Explore our range of case studies, including how SEO can influence your business, boost search rankings, and enhance online visibility.
Keyword statistics
Around 95% of keywords have a monthly search volume of 10 or fewer, suggesting that the vast majority of what people put into search engines are not hugely popular terms.
15% of Google searches every day are brand new, never-before-seen queries. This means search engines are constantly having to adapt and determine which content is most relevant to the user’s query.
Finally, around 14% of all keywords are questions. Using these in your content, followed by a direct answer, can help increase your chances of ranking for that particular phrase.
Google keyword search statistics
As of February 2026, ‘maps’ was the most common search term on Google. Searched by approximately 37.5 million people, this accounted for 1.23% of web traffic for that month.
TABLE 17: Most popular Google searches in the world (February 2026)
|
Position |
Search term |
Traffic share (%) |
Traffic (million) |
Volume (million) |
Traffic leader |
|---|---|---|---|---|---|
|
1 |
maps |
1.23% |
37.50mn |
53.04mn |
google.com |
|
2 |
weather |
0.73% |
22.12mn |
146.87mn |
weather.com |
|
3 |
2026 winter olympics |
0.50% |
15.33mn |
83.76mn |
youtube.com |
|
4 |
t20 world cup |
0.50% |
15.16mn |
159.26mn |
icc-cricket.com |
|
5 |
flamengo |
0.45% |
13.78mn |
66.22mn |
youtube.com |
|
6 |
cricbuzz |
0.45% |
13.66mn |
79.31mn |
cricbuzz.com |
|
7 |
y |
0.41% |
12.33mn |
15.22mn |
youtube.com |
|
8 |
real madrid |
0.34% |
10.23mn |
90.81mn |
realmadrid.com |
|
9 |
nba |
0.28% |
8.43mn |
74.79mn |
nba.com |
|
10 |
제미나이 |
0.26% |
7.96mn |
8.49mn |
gemini.google.com |
Source: Data from Similarweb’s Most Searched Things on Google in 2026, What are the most popular Google searches worldwide?
Note: Similarweb was reviewed as of 5th May 2026; data may now differ.
This was followed by ‘weather’ (22.12 million) and ‘2026 winter olympics’ (15.33 million), which contributed towards respective traffic shares of 0.73% and 0.5%.
Most popular Google searches in the world over time, 2004–26
Our analysis of Google keyword search statistics reveals that:
-
‘Google’ has featured in the top 10 most searched words in Google every year between 2005 and 2026, with the same true for ‘YouTube’ since 2007 and ‘Facebook’ since 2008.
-
Search interest in ‘Google’ and ‘YouTube’ rose in the years since they first appeared in the top 10.
-
Despite being the most searched term between 2009 and 2019, relative searches for ‘Facebook’ have been in decline since 2020, falling from second position to ninth.
-
‘Weather’ and ‘Amazon’ have appeared in the top 10 most searched terms every year since 2016 and 2017, respectively.
-
‘Yahoo’ featured in the 10 most searched words between 2004 and 2016, and has not featured since. A similar trend exists for ‘Hotmail’ between 2006 and 2018.
-
The term ‘news’ has ranked in the top 10 every year since 2012, ranging from fifth to ninth.
AI SEO statistics
ChatGPT was the fifth-most-visited website worldwide in February 2026, according to recent website statistics.
With 5.19 billion visits that month, this was more than double the same period in 2025 (the highest YoY change among the top 10 most visited websites for February 2026).
TABLE 18: Most visited websites in the world, February 2026
|
Position |
Domain |
No. of visits (billion) |
Y-o-Y change (%) |
Main traffic source |
|---|---|---|---|---|
|
1 |
google.com |
88.46bn |
+1.29% |
Direct |
|
2 |
youtube.com |
45.07bn |
-4% |
Direct |
|
3 |
facebook.com |
8.22bn |
-10.05% |
Direct |
|
4 |
instagram.com |
5.32bn |
-2.44% |
Direct |
|
5 |
chatgpt.com |
5.19bn |
+110.79% |
Direct |
|
6 |
reddit.com |
4.45bn |
+17.9% |
Search |
|
7 |
wikipedia.org |
3.77bn |
-14.35% |
Search |
|
8 |
pornhub.com |
3.34bn |
-12.1% |
Search |
|
9 |
x.com |
3.28bn |
+27.74% |
Direct |
|
10 |
whatsapp.com |
2.49bn |
-4.99% |
Direct |
Source: Data from Semrush’s Top Websites in the World, Most Visited Websites in the World
Note: The site was reviewed as of 13th April 2026; data may have changed since then.
By contrast, Google was the most visited website in February 2026. With 88.46 billion visits, this was around 17 times more popular than ChatGPT. Yet its YoY change was approximately 85 times less than ChatGPT’s, at +1.29%.
AI overview statistics
Google’s AI Mode is now available in more than 200 countries and territories worldwide. With over two billion monthly AI overview users, this accounts for more than 10% of global queries.
How many people use the Gemini app?
According to Google’s Q4 2025 earnings report, the Gemini app has more than 750 million monthly active users.
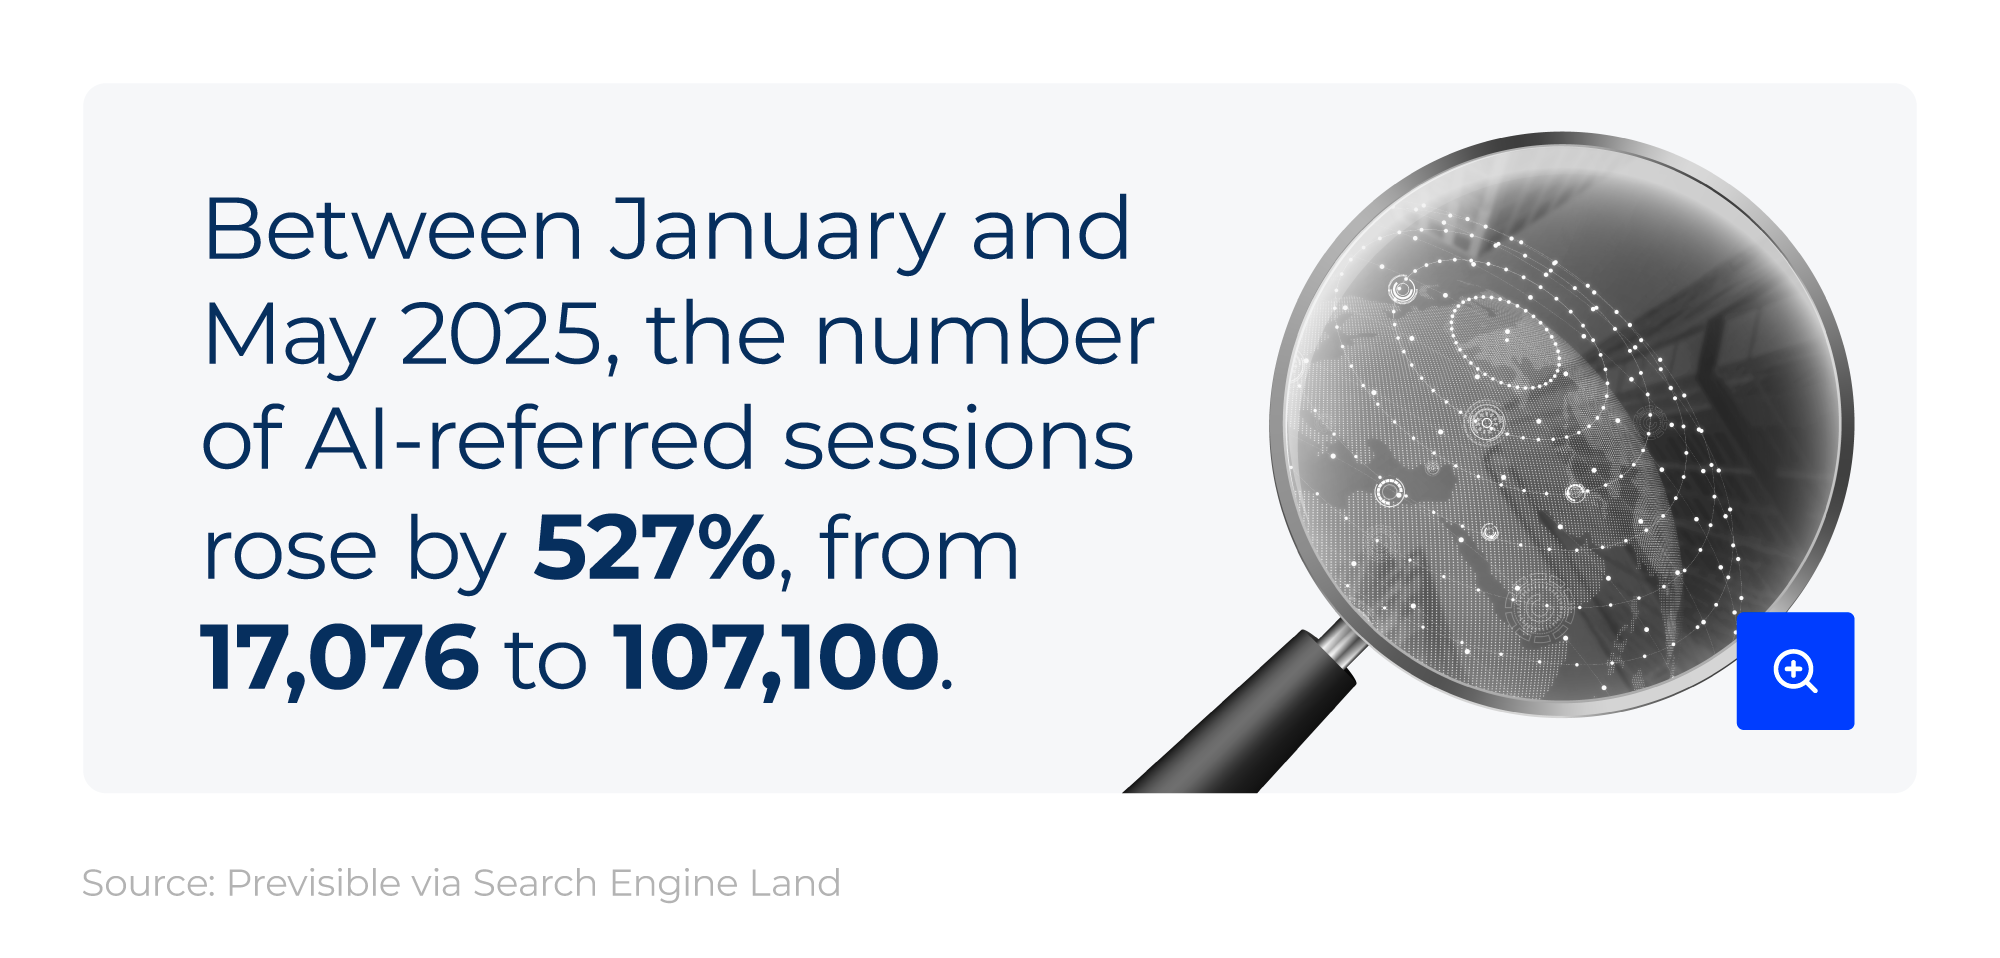
According to the 2025 Previsible AI Traffic Report, the total number of AI-referred sessions between January 2025 and May 2025 jumped from 17,076 to 107,100. This represented a 527% increase in five months.
Some SaaS sites see more than 1% of all sessions come from LLMs, with legal, finance, small and medium-sized business (SMB), insurance, and health accounting for 55% of all LLM-driven sessions.
Semrush analysis of more than 10 million keywords and clickstream data in the US found that:
-
15.69% of queries in November 2025 triggered an AI overview (compared to 24.61% in July and 6.49% in January).
-
91.3% of queries in January 2025 that triggered an AI overview were informational, compared to 57.1% in October.
-
Navigational searches in 2025 that triggered an AI overview rose from 0.74% in January to 10.33% in October.
-
The industries with the most AI overviews, as of November 2025, were science (25.96%), computers and electronics (17.92%), and people and society (17.29%).
-
Keywords with AI overviews had an average monthly search volume of 338 and a median search volume of 70 in March 2025. Yet, by October 2025, these figures had risen to 2,271 and 90, respectively.
These findings suggest a shift in how Google ranks information and answers questions. As the SERP becomes more generative, the focus for SEO shifts from position to presence. Companies that adapt to these changes are more likely to thrive and survive in the post-click world of SEO and GEO.
Did you know?
Results from our LLMs.txt experiment show that no AI bots had visited our test web pages and LLMs.txt files after three months of going live. This suggests that such files are not needed for greater AI visibility and performance.
AI search visitor statistics
Research by SEMrush suggests that AI search visitors will exceed traditional search visitors by 2028. For example, the number of weekly ChatGPT users now exceeds 800 million (a figure that grew by a factor of eight between October 2023 and April 2025). As of February 2026, 900 million users use ChatGPT weekly.
Based on conversion rates, the average LLM visitor is worth 4.4 times as much as the average organic search visitor. When an AI user visits a site, they are likely already familiar with the products and services on offer and have compared their options. This puts them in a stronger position to convert.
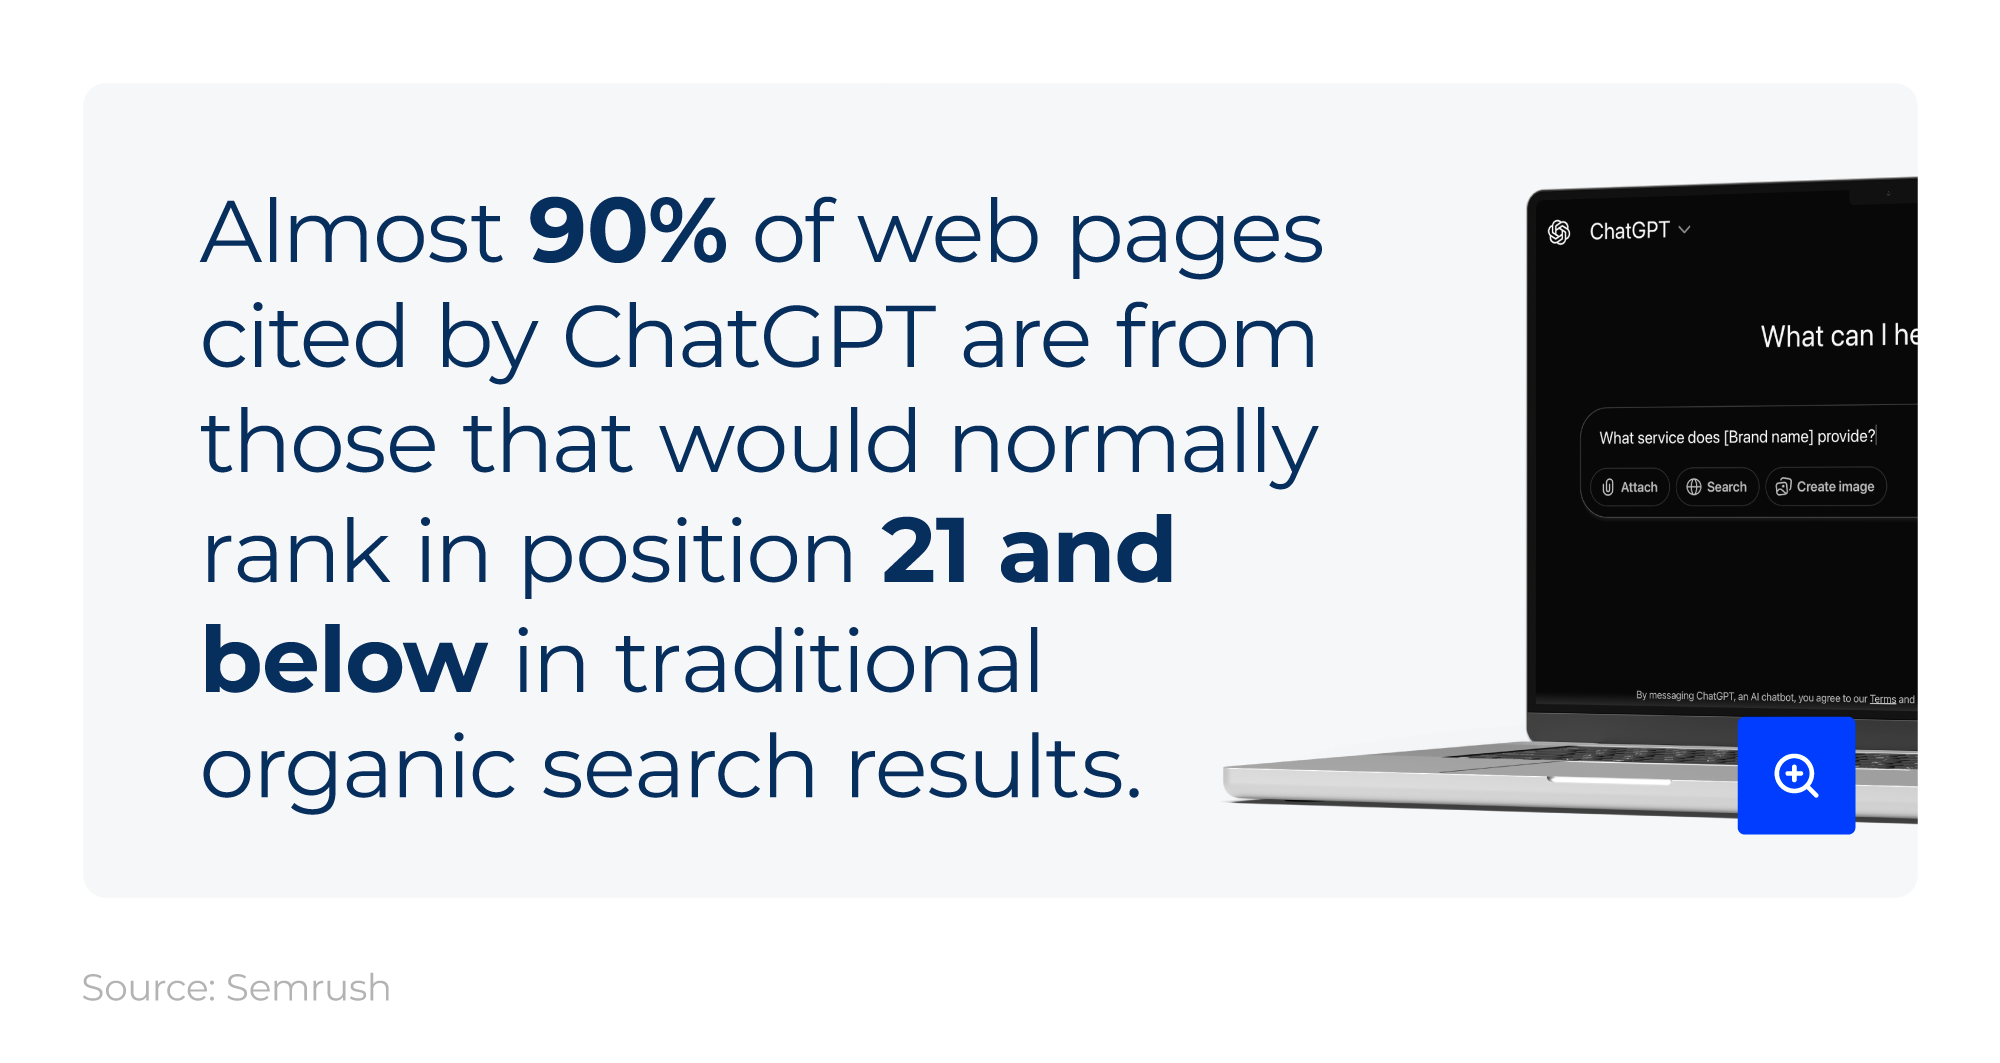
Almost 90% of the web pages ChatGPT cites would normally rank in positions 21 and below in traditional organic search. AI systems focus on relevance and surface-level information rather than entire web pages, unlike traditional search engines. Therefore, LLMs are trained to focus on delivering the best response for a specific user rather than the average user.
Our GEO playbook covers how to optimise your site for AI search, strengthen authority with AiPR®, and monitor AI visibility.
AI SEO usage statistics
Semrush’s 2024 report Thinking Big with AI surveyed 2,600 global businesses on the state and future trends of AI in content marketing.
They found that:
-
67% of businesses use AI for content marketing and SEO.
-
65% saw improved SEO results from using AI, and 78% were satisfied with the results.
-
67% noticed an improvement in content quality after turning to AI, with 68% experiencing a higher ROI.
-
93% review AI-generated content before publishing it.
-
37% of those who don’t use AI admitted they don’t understand how it works.
Furthermore, a HubSpot survey of more than 100 US-based SEO professionals found that 73% either strongly or somewhat felt that AI tools, features, or solutions are becoming an important part of their company’s search strategy.
How important is AI to an SEO strategy?
Nearly 75% of respondents also claim to use AI to save time, for tasks like optimising websites for technical SEO and improving search rankings.
TABLE 19: What factors could decrease search traffic in the next six months?
|
Factor |
Percentage of respondents (%) |
|---|---|
|
Generative AI chatbots |
13% |
|
Generative AI search engines |
6% |
|
Google’s AI Overviews |
6% |
|
Social media search engines |
6% |
|
Google E-E-A-T and algorithm updates |
2% |
Source: Data from HubSpot’s SEO trends for 2026: How search and AI are changing, Zero-Click Search Optimization Takes Priority
13% of SEO professionals surveyed by HubSpot said generative AI chatbots could decrease search traffic in the near future. This was around double the proportion that selected generative AI search engines, Google’s AI Overviews, and social media search engines as their primary threat to future search traffic (all 6%).
In a survey of more than 1,500 marketers, HubSpot’s 2026 report on the State of Marketing concluded that:
-
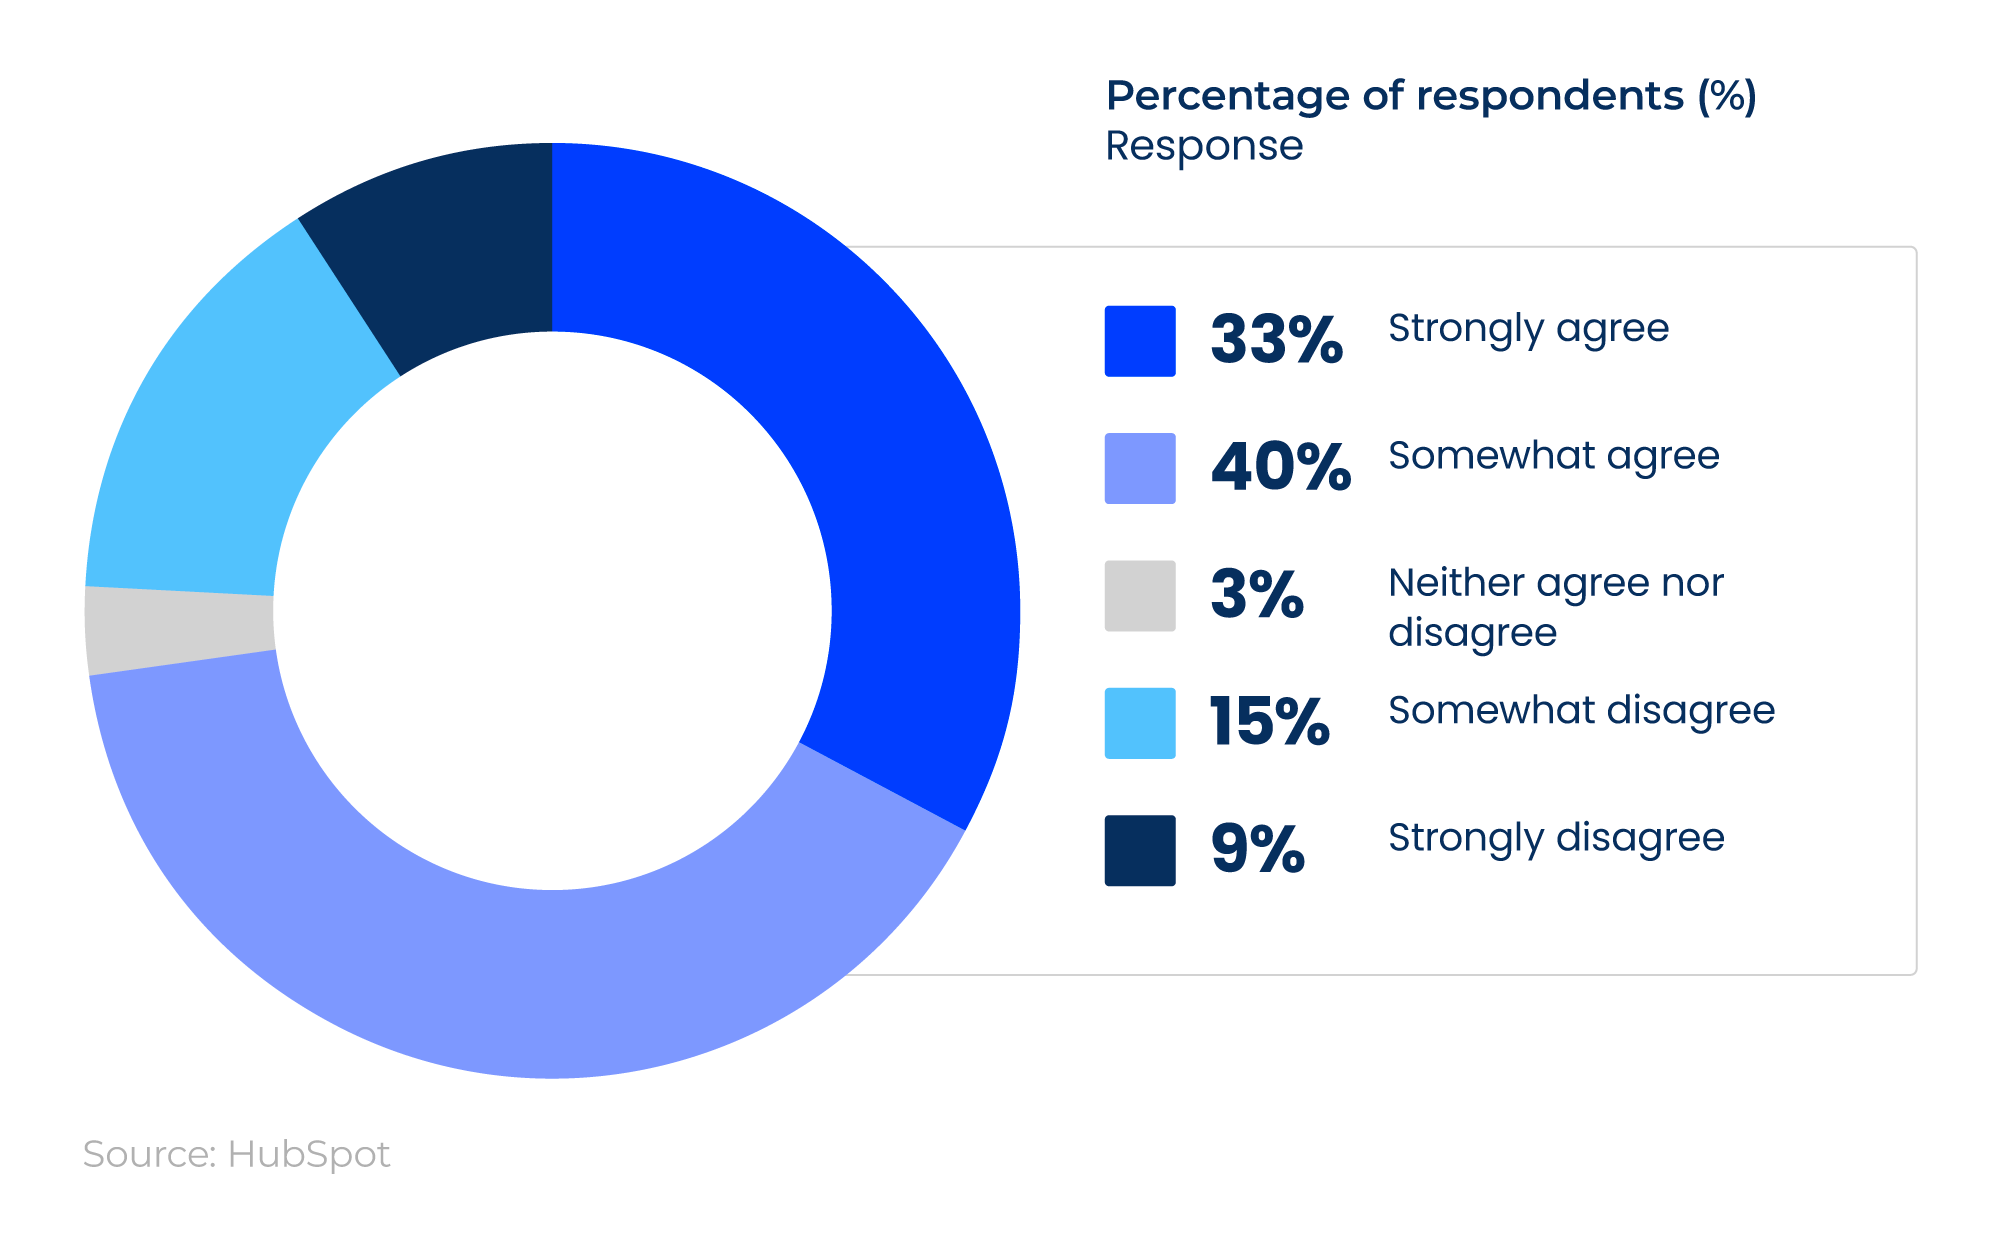
61% agree that taste and brand POV are more important now than ever when it comes to humans and AI working together.
-
58% feel that, despite search traffic being on the decline, AI referral traffic has much higher intent (with visitors arriving at your site much further into the buyer journey than previously).
-
60% believe you need seamless purchasing experiences with chatbots to convert customers.
-
61% say marketing is experiencing its biggest disruption in 20 years due to AI.
-
67% claim AI saves them 10 or more hours per week, with 68% saying it has boosted productivity.
-
63% feel more unique, human-centred content is needed to stand out
-
80% use AI for content creation, with 75% using it for media production.
-
41% say that updating their SEO strategy for changes in search is the top trend they’re exploring.
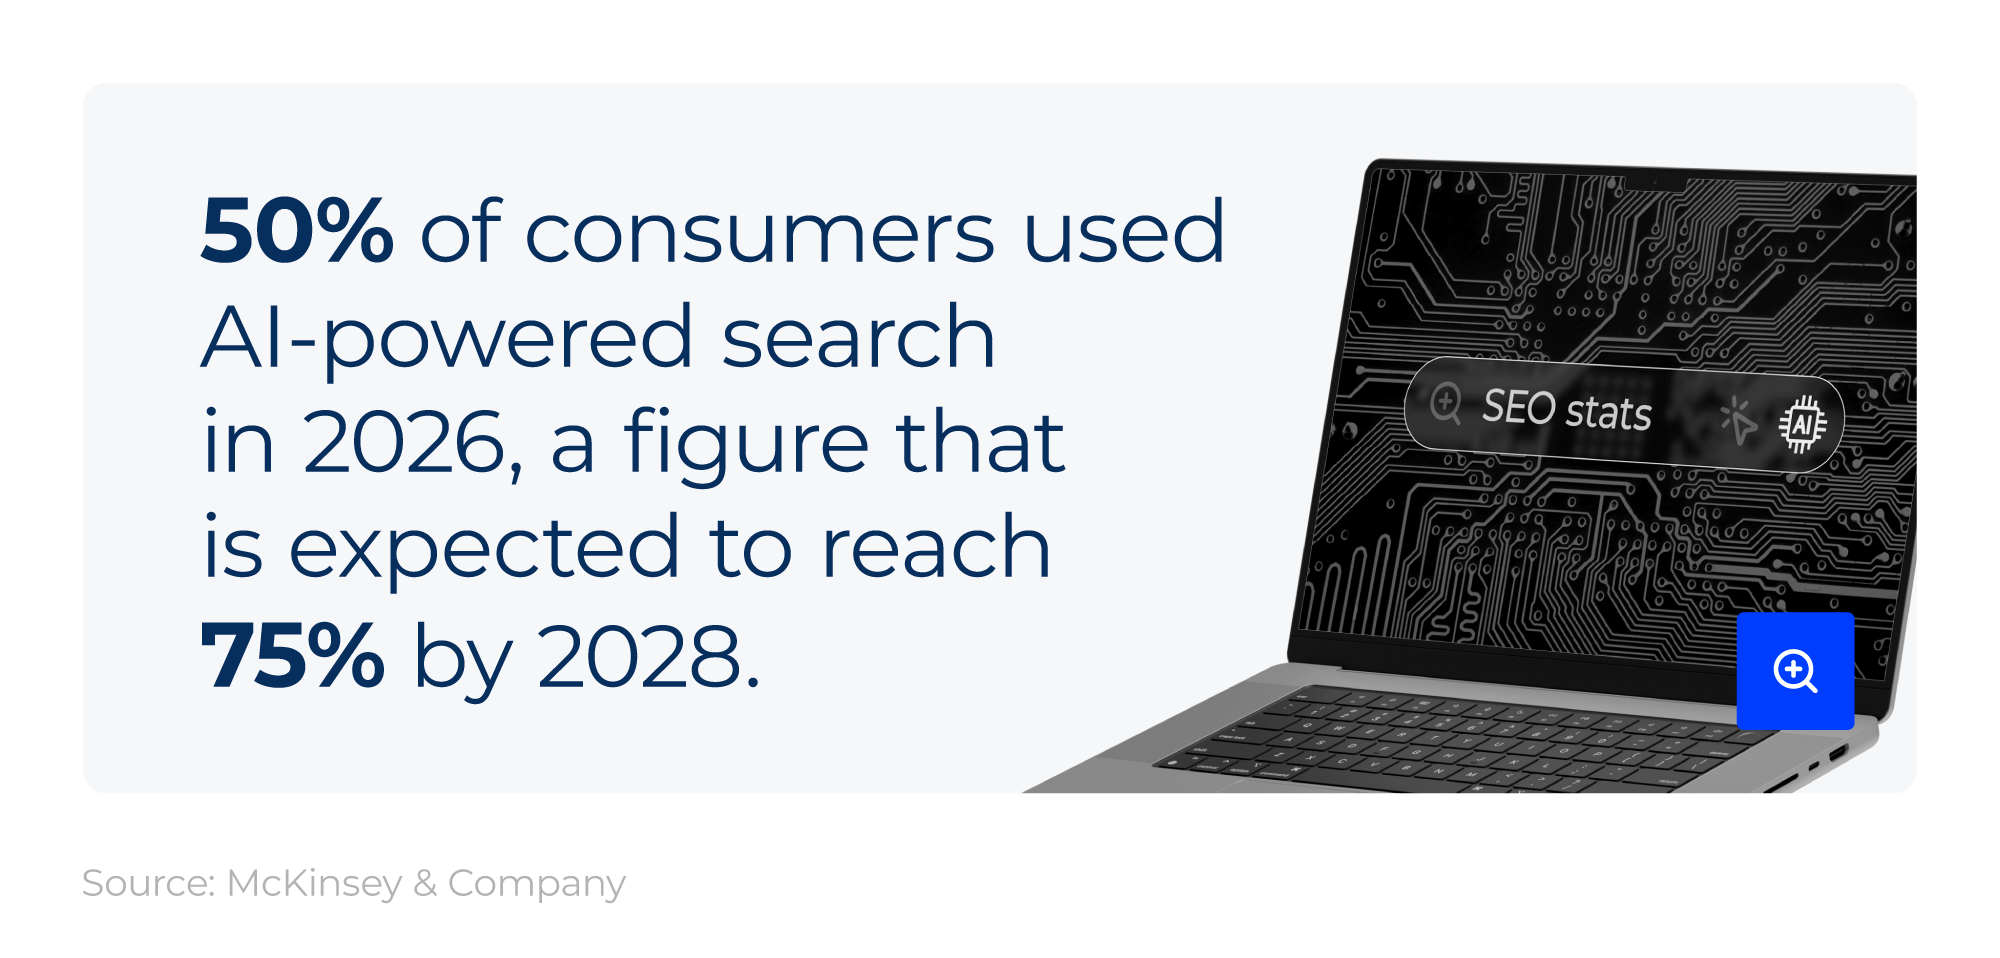
Consumer research by McKinsey & Company also found that 50% of consumers used AI-powered search in 2025. This figure is expected to rise to 75% by 2028.
By 2028, an estimated $750 billion in US revenue will come from AI-powered search, by which point unprepared brands could see a 20–50% decline.
TABLE 20: Use of AI-powered search at different stages of the customer journey
|
Stage |
Section |
Percentage of users (%) |
|---|---|---|
|
Awareness |
Learning broadly about a category, brand, product, or service |
73% |
|
Planning for a trip or special occasion |
53% |
|
|
Consideration |
Explaining features or technical specifications |
60% |
|
Generating personalised recommendations |
57% |
|
|
Decision |
Comparing specific products and/or services |
61% |
|
Summarising review for specific products or features |
60% |
Source: Data from McKinsey’s New front door to the internet: Winning in the age of AI search, The AI-powered consumer decision journey, Exhibit 1
Most consumers tend to use AI-powered search during the awareness stage of the customer journey, with almost three in four using it to learn broadly about a category, brand, product, or service.
Roughly three in five people turn to AI search towards the end of the decision journey, such as comparing specific products, services or both, or requesting a summarised review of what they intend to buy.
Check out our latest AI statistics report for more facts and figures on the world of artificial intelligence and its impact on search.
Use of AI-powered search in the purchasing journey by sector
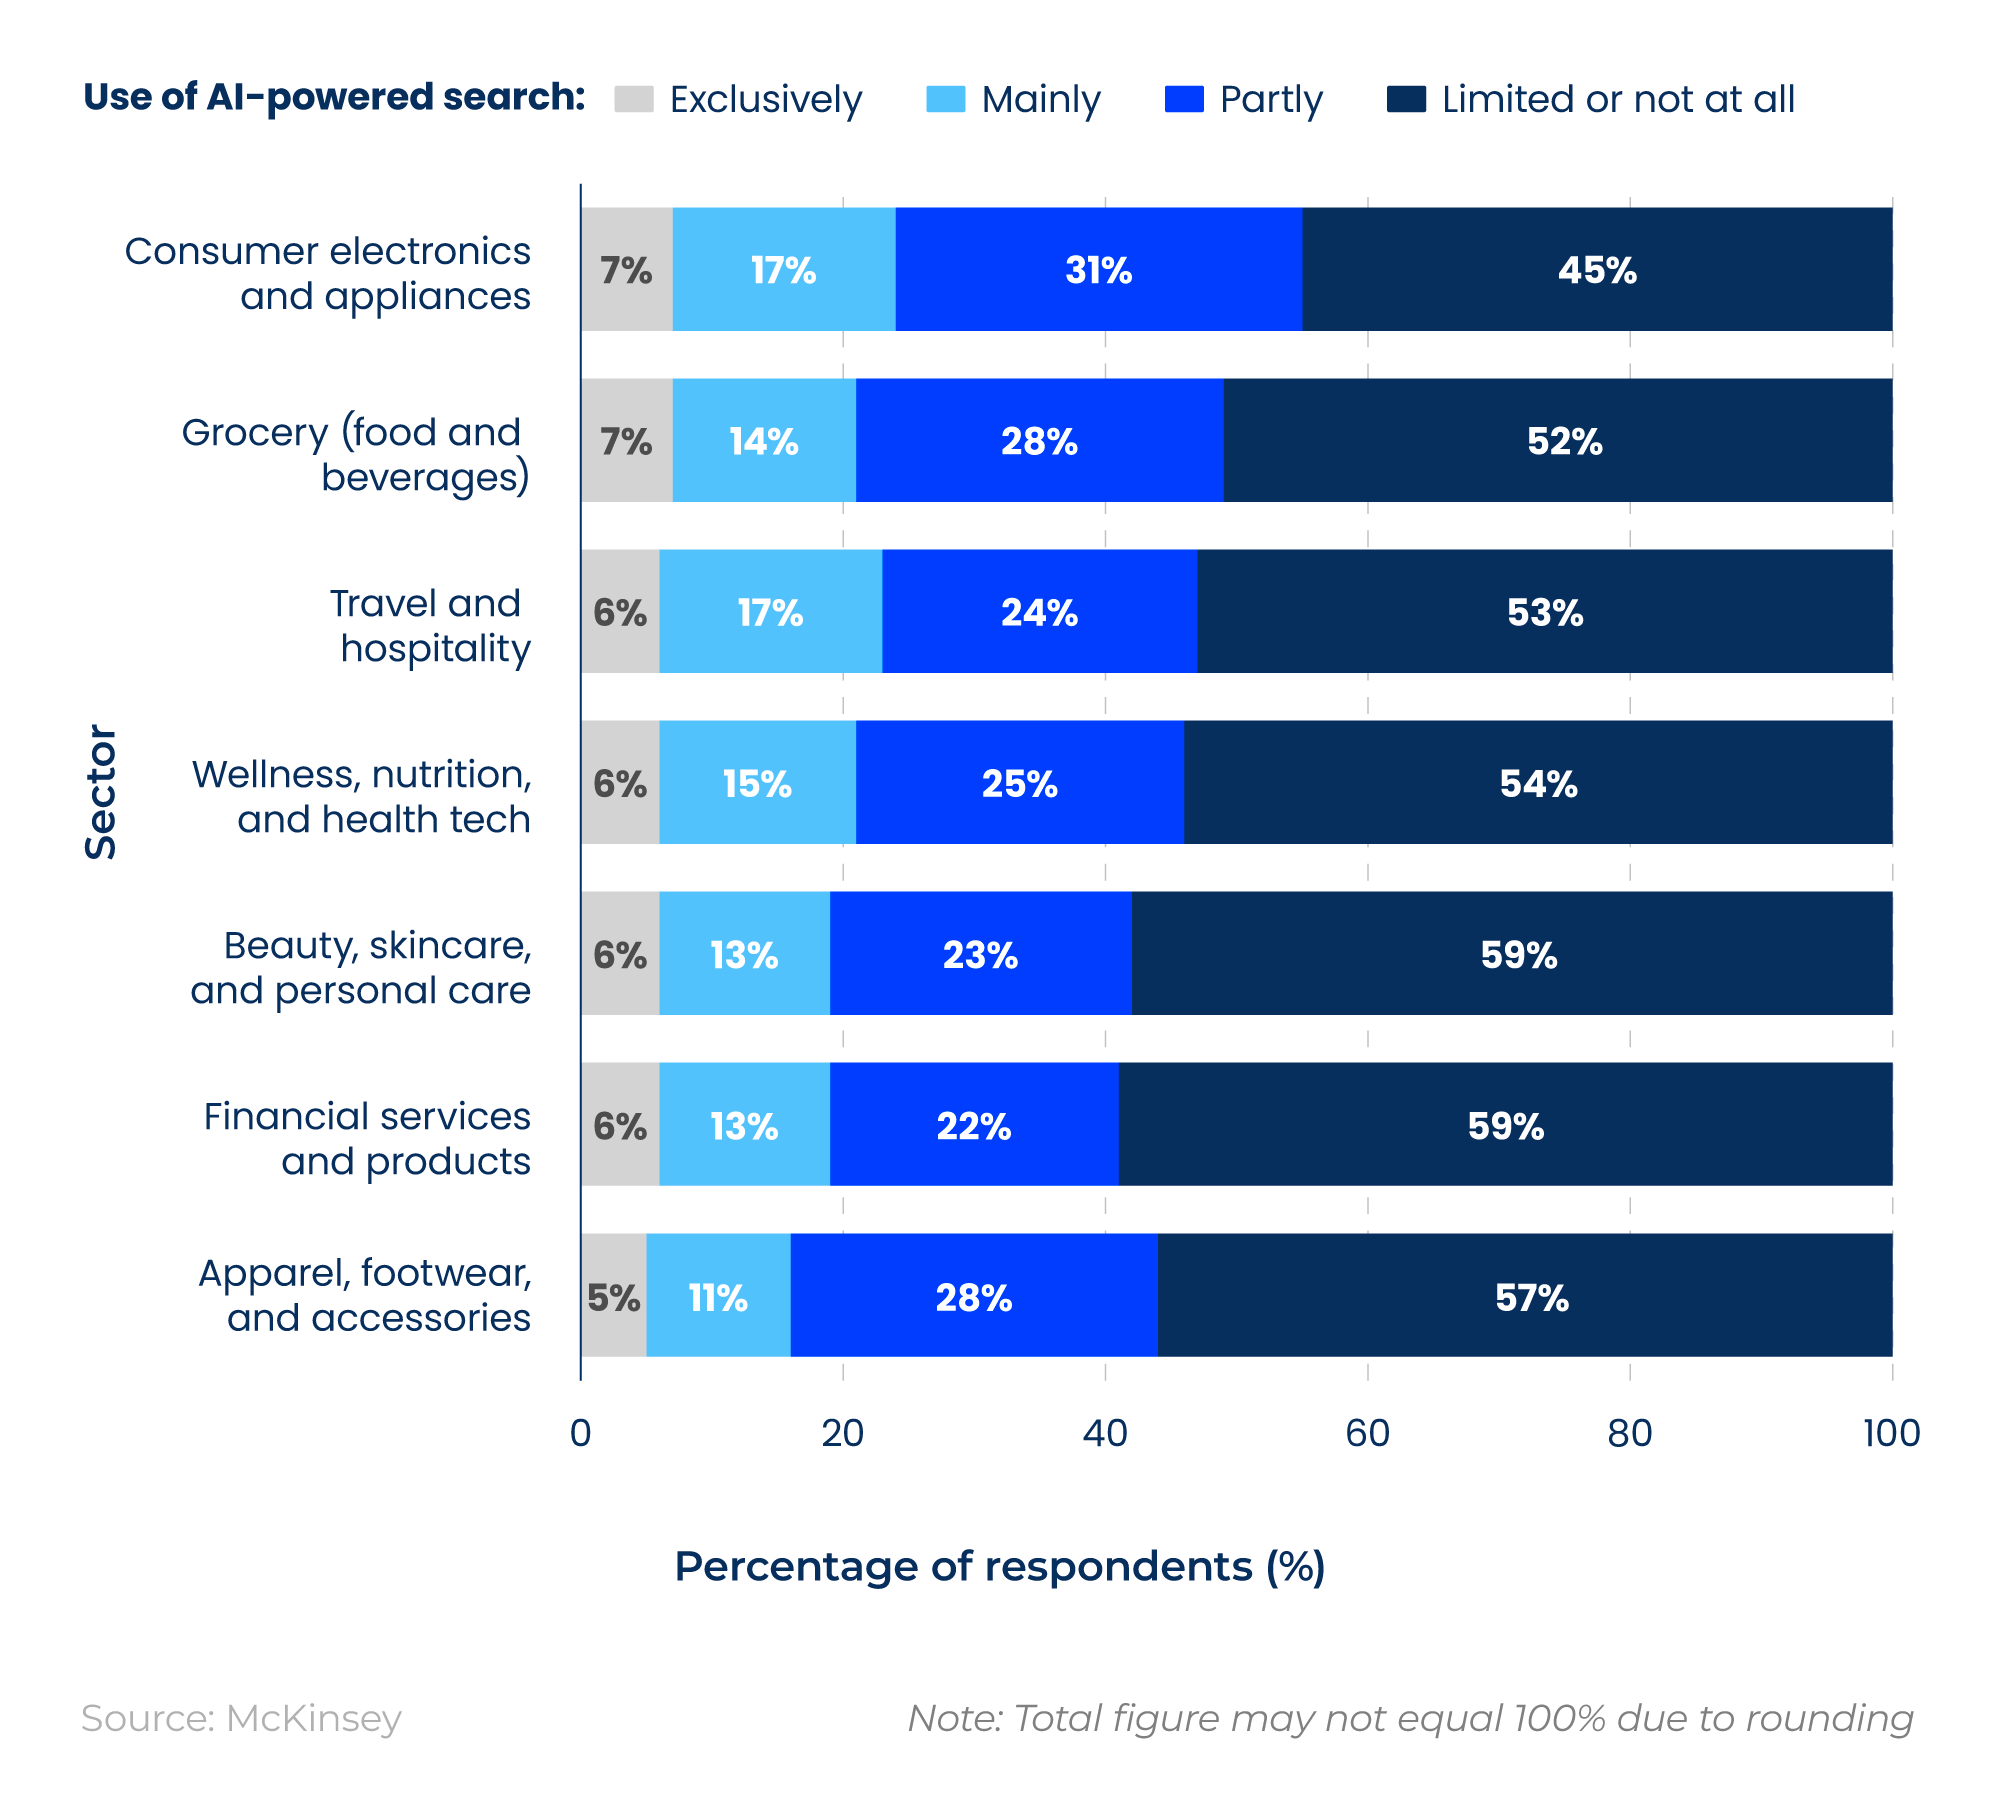
Approximately 55% of customers in the consumer electronics and appliances sector use AI-powered search in the purchasing journey (the highest proportion across all sectors).
This is followed by 49% in the grocery sector and 47% in the travel and hospitality industry.
Use of AI-powered search as the preferred source of information among consumers
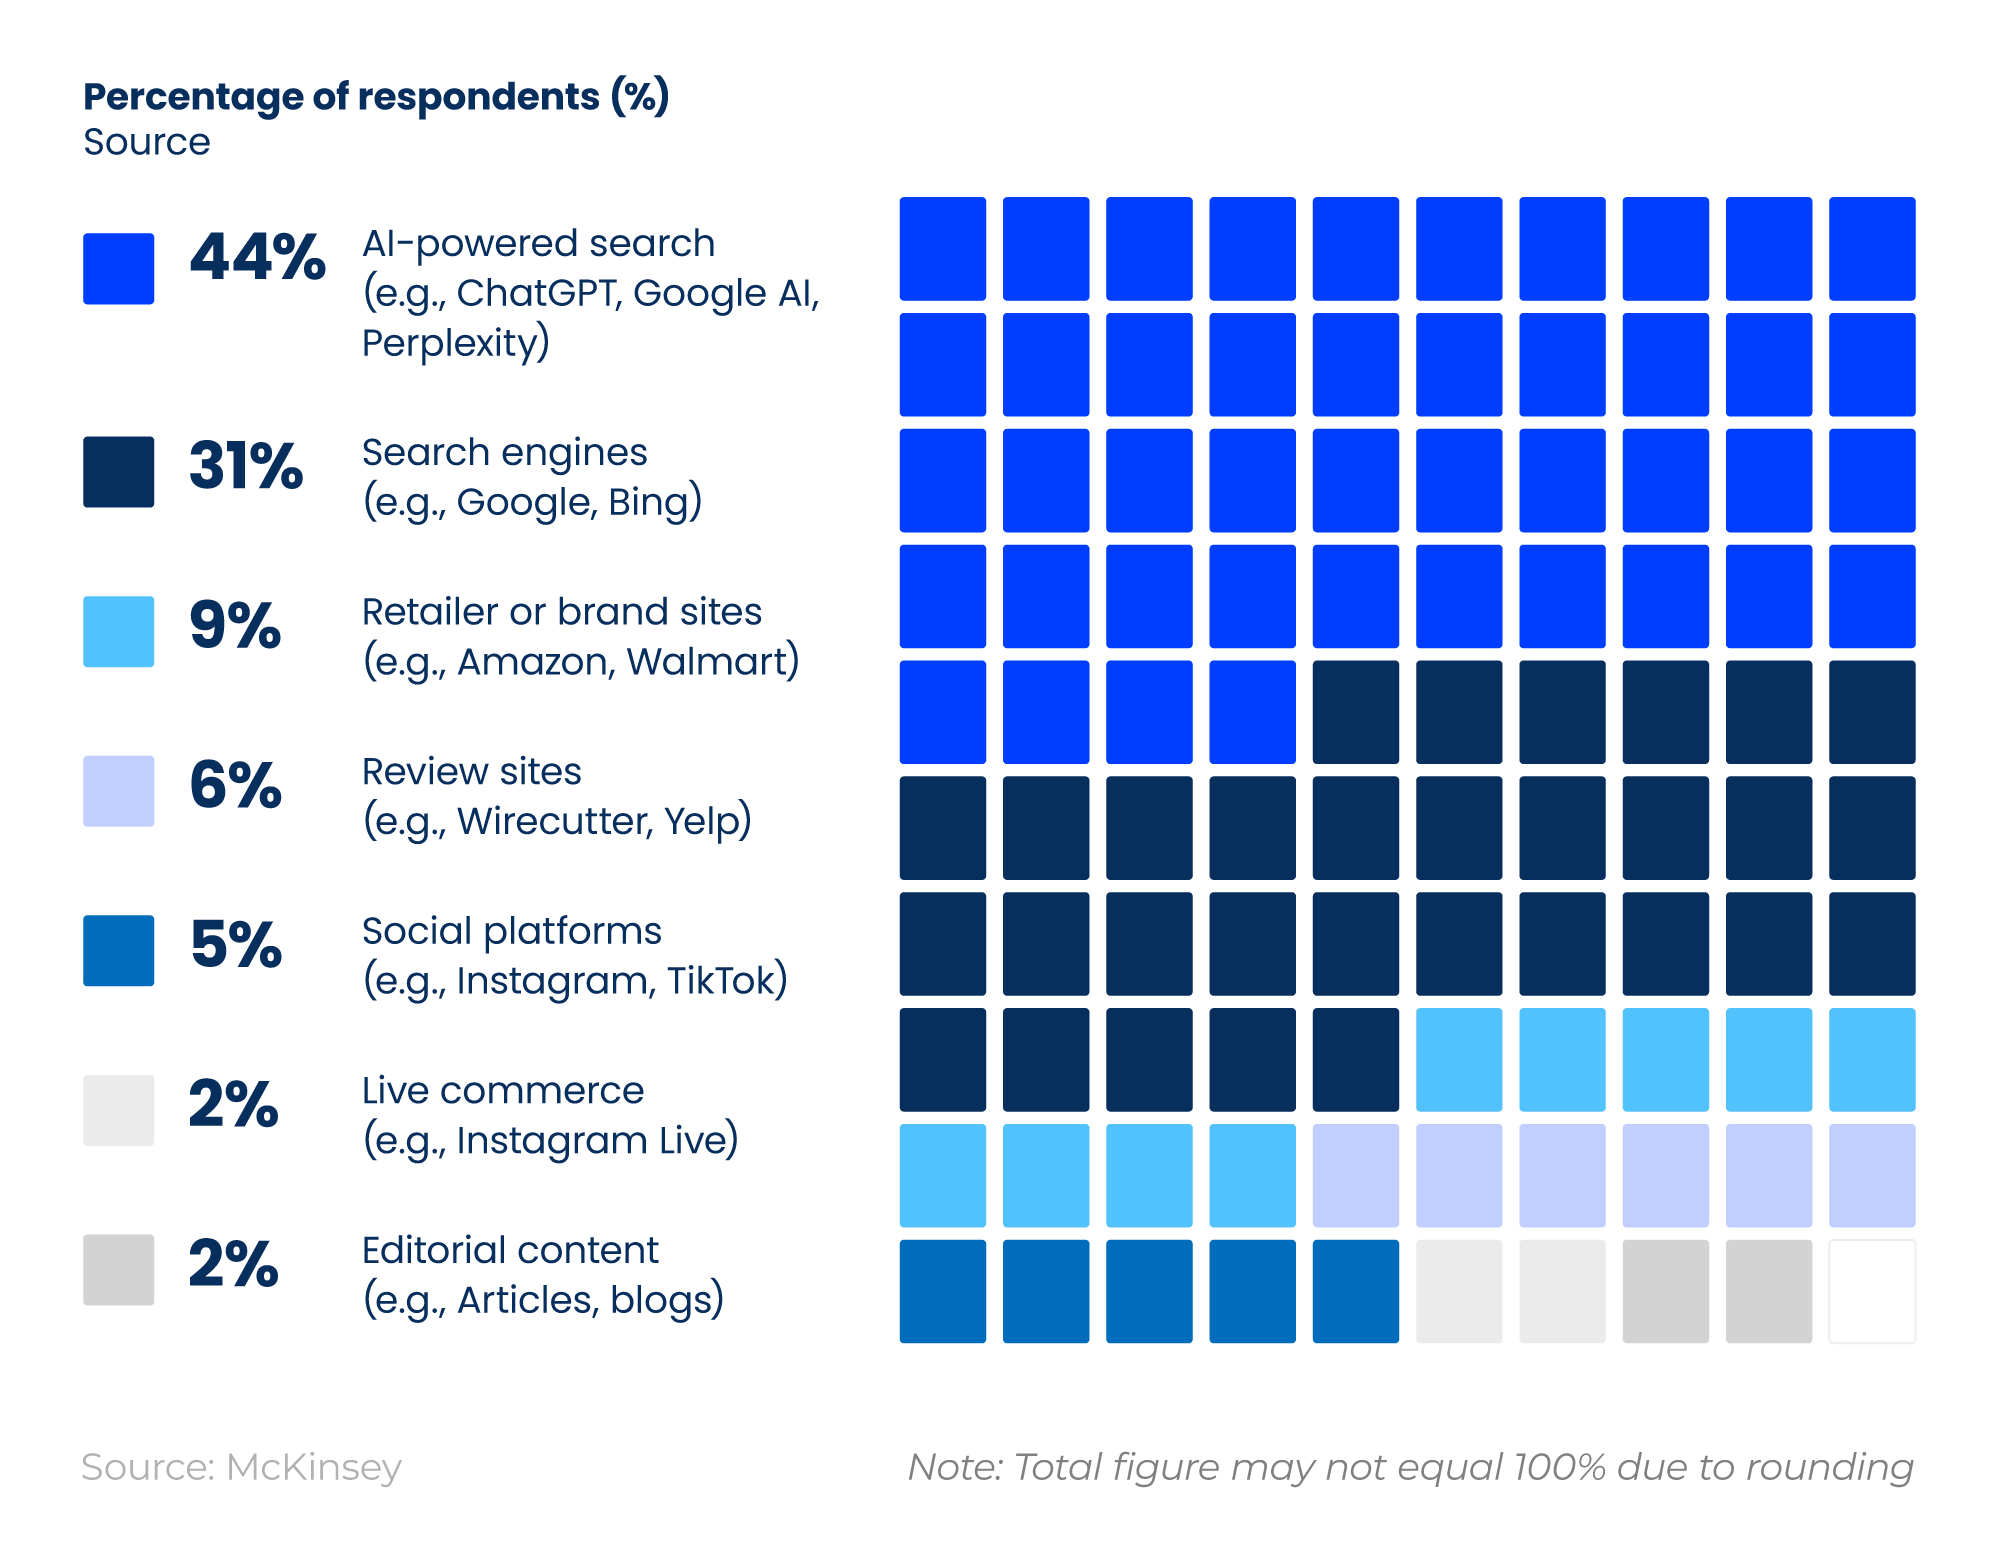
AI SEO statistics from McKinsey reveal that 44% of consumers prefer to use AI-powered search tools (such as ChatGPT, Google AI, and Perplexity) as their primary source of information.
This was followed by 31% who use traditional search engines like Google and Bing, and 9% who opt for retailer or brand websites, such as Amazon and Walmart.
TABLE 21: Use of AI-powered search by information source and topic
|
Source |
Consumer packaged goods (%) |
eCommerce (%) |
Financial services (%) |
Telecommunications (%) |
|---|---|---|---|---|
|
Affiliate blogs and websites |
50% |
<5% |
50% |
15% |
|
User-generated content (UGC) |
15% |
10% |
10% |
10% |
|
Academic and market research |
10% |
<5% |
<5% |
… |
|
Brand and retailer |
10 |
80 |
20 |
45 |
|
News and media |
10% |
5% |
15% |
10% |
|
Other (Google, Wikipedia) |
5% |
5% |
<5% |
20% |
Source: Data from McKinsey’s New front door to the internet: Winning in the age of AI search, Why your brand might not show up, Exhibit 5
AI SEO research by McKinsey found that:
-
50% of those working with consumer-packaged goods and financial services use AI-powered search as a source of information for affiliate blogs and websites, compared to 80% in eCommerce who use it for brand and retailer purposes.
-
Other sources (such as Google and Wikipedia) are more commonly used in the telecommunications sector for AI-powered search information (20%) than in financial services (less than 5%).
-
AI-powered search as a source of information for news and media ranges from 5% in eCommerce to 15% in financial services.
-
Academic and market research is the least common reason businesses use AI search, with fewer than 5% of respondents in eCommerce and financial services, and only 10% of those working in consumer-packaged goods.
Our recent controlled GEO experiment showed that it’s possible to influence responses by some AI models by strategically publishing your desired output across third-party websites.
We’ve also conducted an AI vs human SEO content-writing experiment to see whether AI and humans would perform equally well. Findings show AI-generated domains had an average ranking of 6.6 compared to 6.4 for human-written content. Statistical testing indicated a significant difference in median ranks on 92% of occasions.
Check out our range of SEO experiments for other research into other SEO trends and statistics.
Latest SEO trends 2026
SEO search trends
As of 2025, relative search interest for SEO-related terms was highest for ‘SEO company’, with a Google Trends index score of 56. This was about five times as popular as in 2008.
Our analysis of Google Trends data shows that:
-
Only three terms (‘search engine optimisation’, ‘SEO’, and ‘SEO tools’) appeared in 2004 based on relative popularity.
-
By 2025, ‘search engine optimisation’ was relatively less popular, with an index score of 14. All other SEO search terms on our list had index scores of 30 or higher.
-
By 2030, maximum relative search interest is expected to be reached for many SEO keywords, including ‘AI SEO’, ‘SEO agency’, ‘SEO company’, ‘SEO marketing’, ‘SEO services’, and ‘SEO tools’.
Most common SEO search terms over time, 2004–30
More recent developments in Google Trends data reveal that:
-
Relative search interest in ‘AI SEO’ increased by 3,300% between 2020 and 2025.
-
The term ‘SEO agency’ has sustained a Google Trends index score of more than 20 since 2020, rising to 48 in 2025.
-
The index score for ‘SEO consultant’ has remained in double figures since 2009 and has stayed above 40 since 2020.
-
Between 2010 and 2025, relative searches for ‘SEO’ generally fluctuated between 20 and 40, peaking at 57 in 2020.
Read our blog on the history of SEO to see how SEO has developed over time.
TABLE 22: SEO sentiment analysis of Reddit posts, 2026
|
Subreddit |
No. of posts |
No. of comments |
Mean average sentiment score |
|---|---|---|---|
|
bigseo |
4,262 |
17,756 |
0.118603053 |
|
SEO |
46,544 |
208,672 |
0.152455419 |
|
seogrowth |
5,508 |
39,981 |
0.183533827 |
|
TechSEO |
4,804 |
16,756 |
0.117827727 |
Source: Data collected by Reboot Online via Reddit
Our sentiment analysis of Reddit posts reveals mean average sentiment scores between 0.1 and 0.2. This suggests that sentiment towards SEO in 2026 is generally positive.
TABLE 23: Most common topics in SEO subreddits, 2026
|
SEO topic |
Count |
Percentage of count (%) |
|---|---|---|
|
SEO |
113,573 |
19.65 |
|
content |
59,253 |
10.25% |
|
AI |
44,466 |
7.69% |
|
search |
36,796 |
6.37% |
|
traffic |
24,808 |
4.29% |
|
bot |
22,239 |
3.85% |
|
link |
18,533 |
3.21% |
|
authority |
18,059 |
3.12% |
|
ranking |
16,285 |
2.82% |
|
keyword |
14,557 |
2.52% |
Source: Data collected by Reboot Online via Reddit
As expected, SEO is the most common topic in SEO subreddits, accounting for almost a fifth of all mentions.
This was almost twice as common as the term ‘content’ in second place at 10.25%.
‘AI’ and ‘search’ were also apparent in 7.69% and 6.37%, respectively, of all SEO terms mentioned in SEO subreddits in 2026.
SEO and content marketing trends
According to their State of Marketing report, HubSpot found that 48.57% of marketers plan to use AI to create personalised content in 2026.
The role of SEO in the top marketing trends, 2026
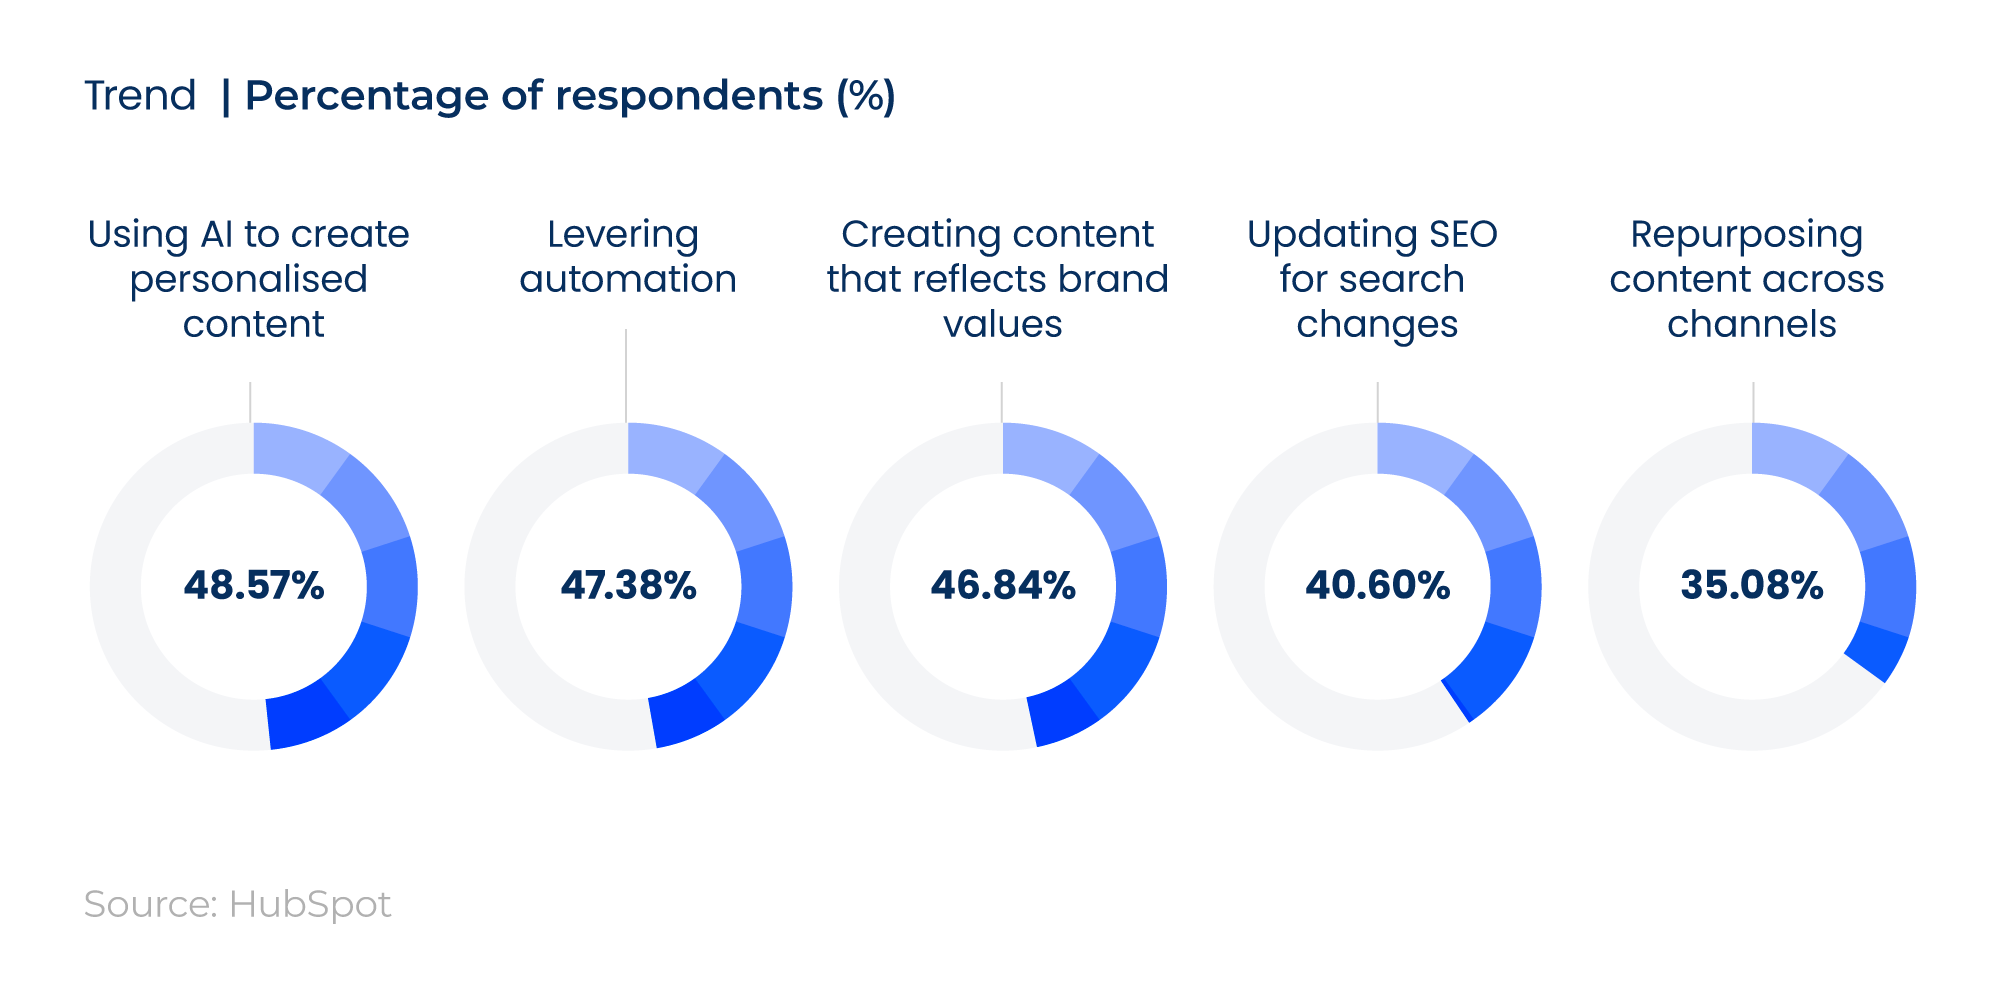
This was closely followed by 47.38% who want to leverage automation and 46.84% who will create content that better reflects their brand’s values.
Number of SEO blogs visited each week by marketers
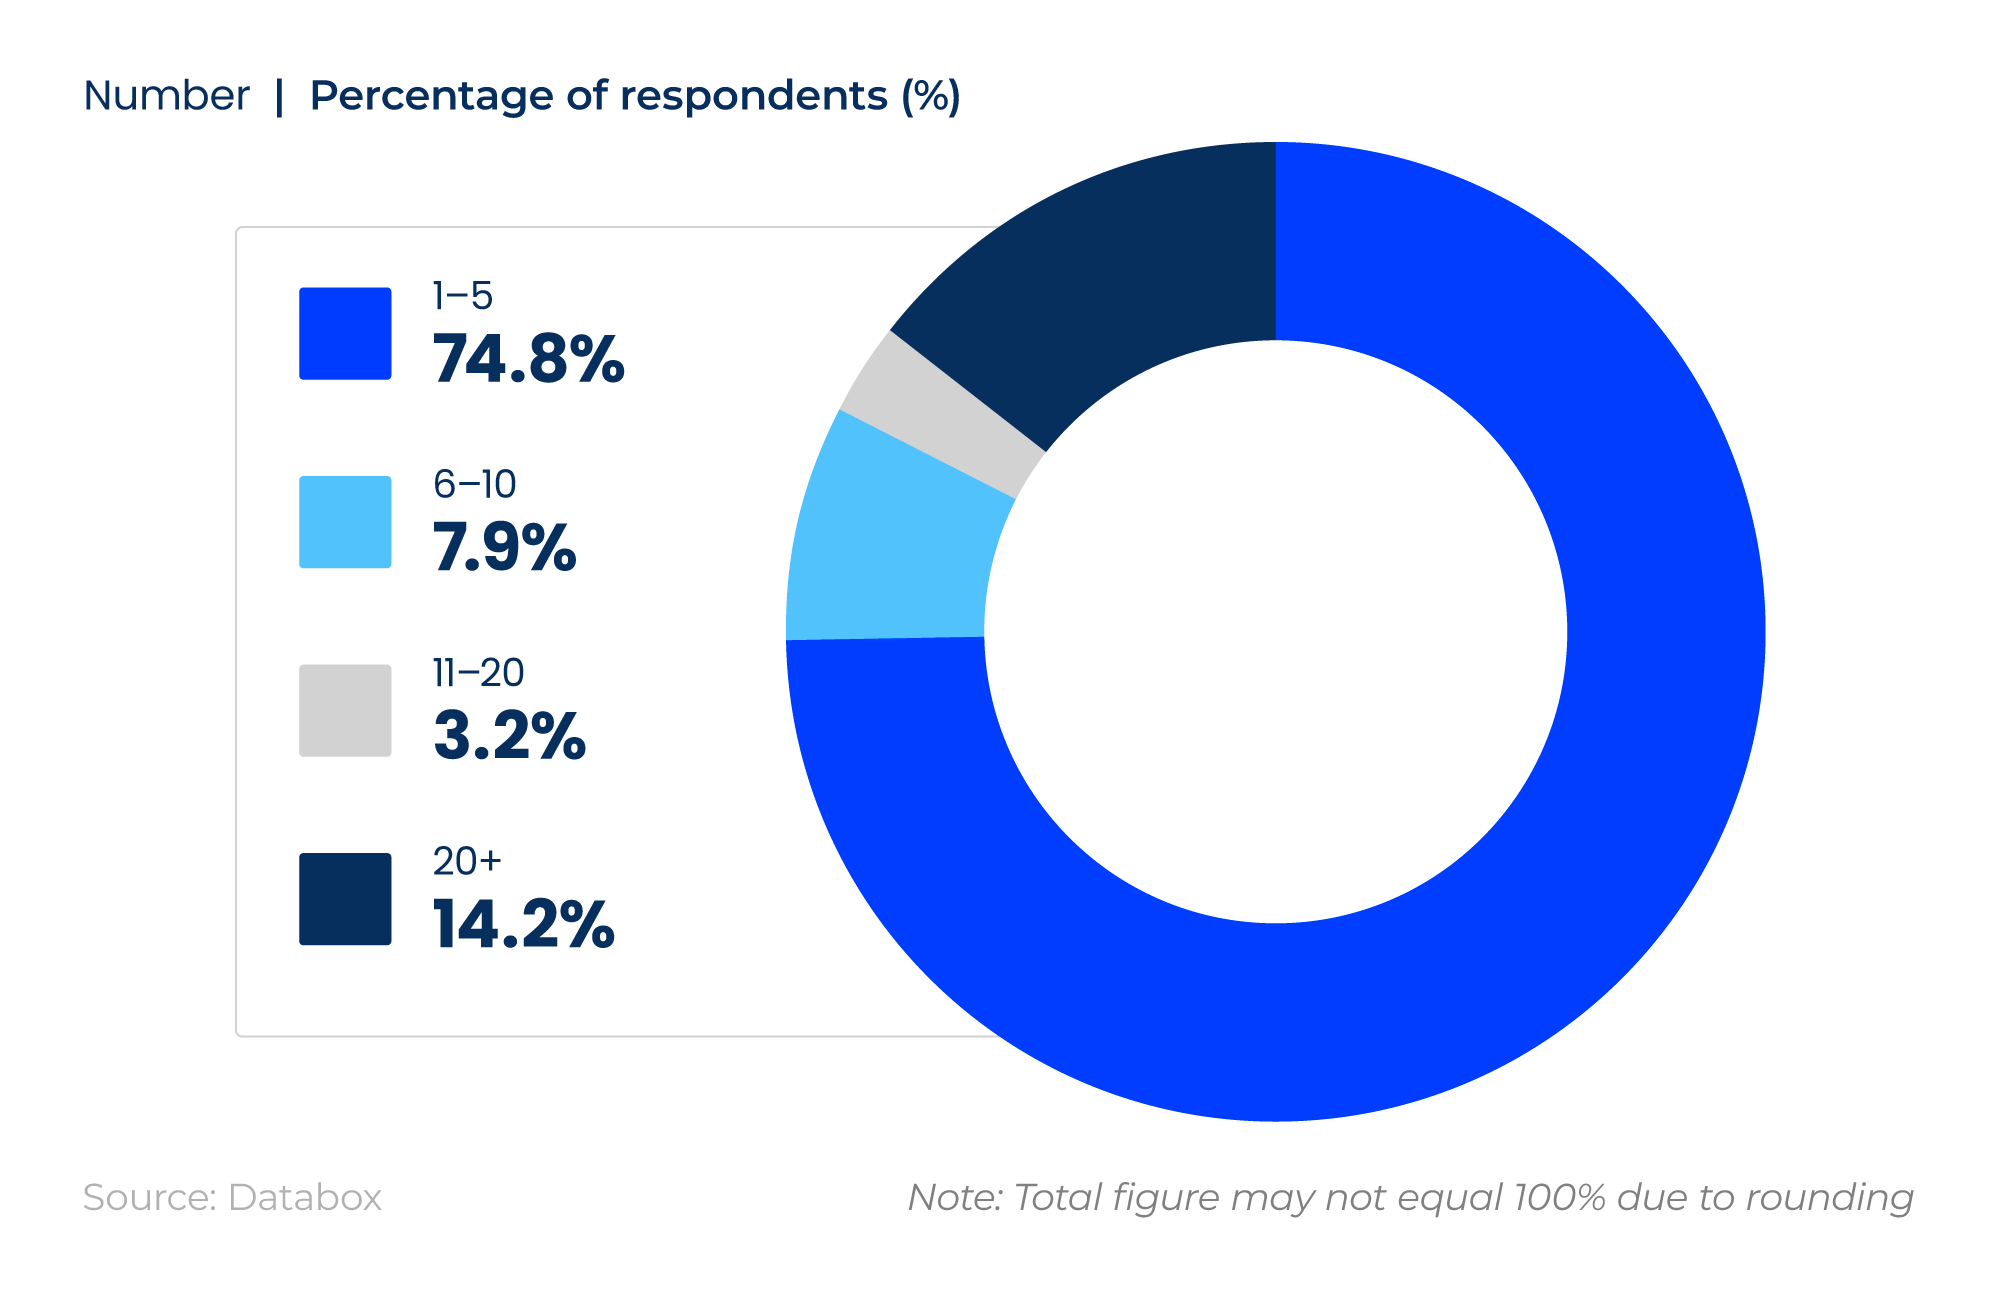
Almost three-quarters of SEOs and marketers surveyed by Databox admit to reading up to five SEO blogs every week.
This is contrasted by around one in seven who visit more than 20 SEO blogs a week.
Most recommended SEO blogs by marketers
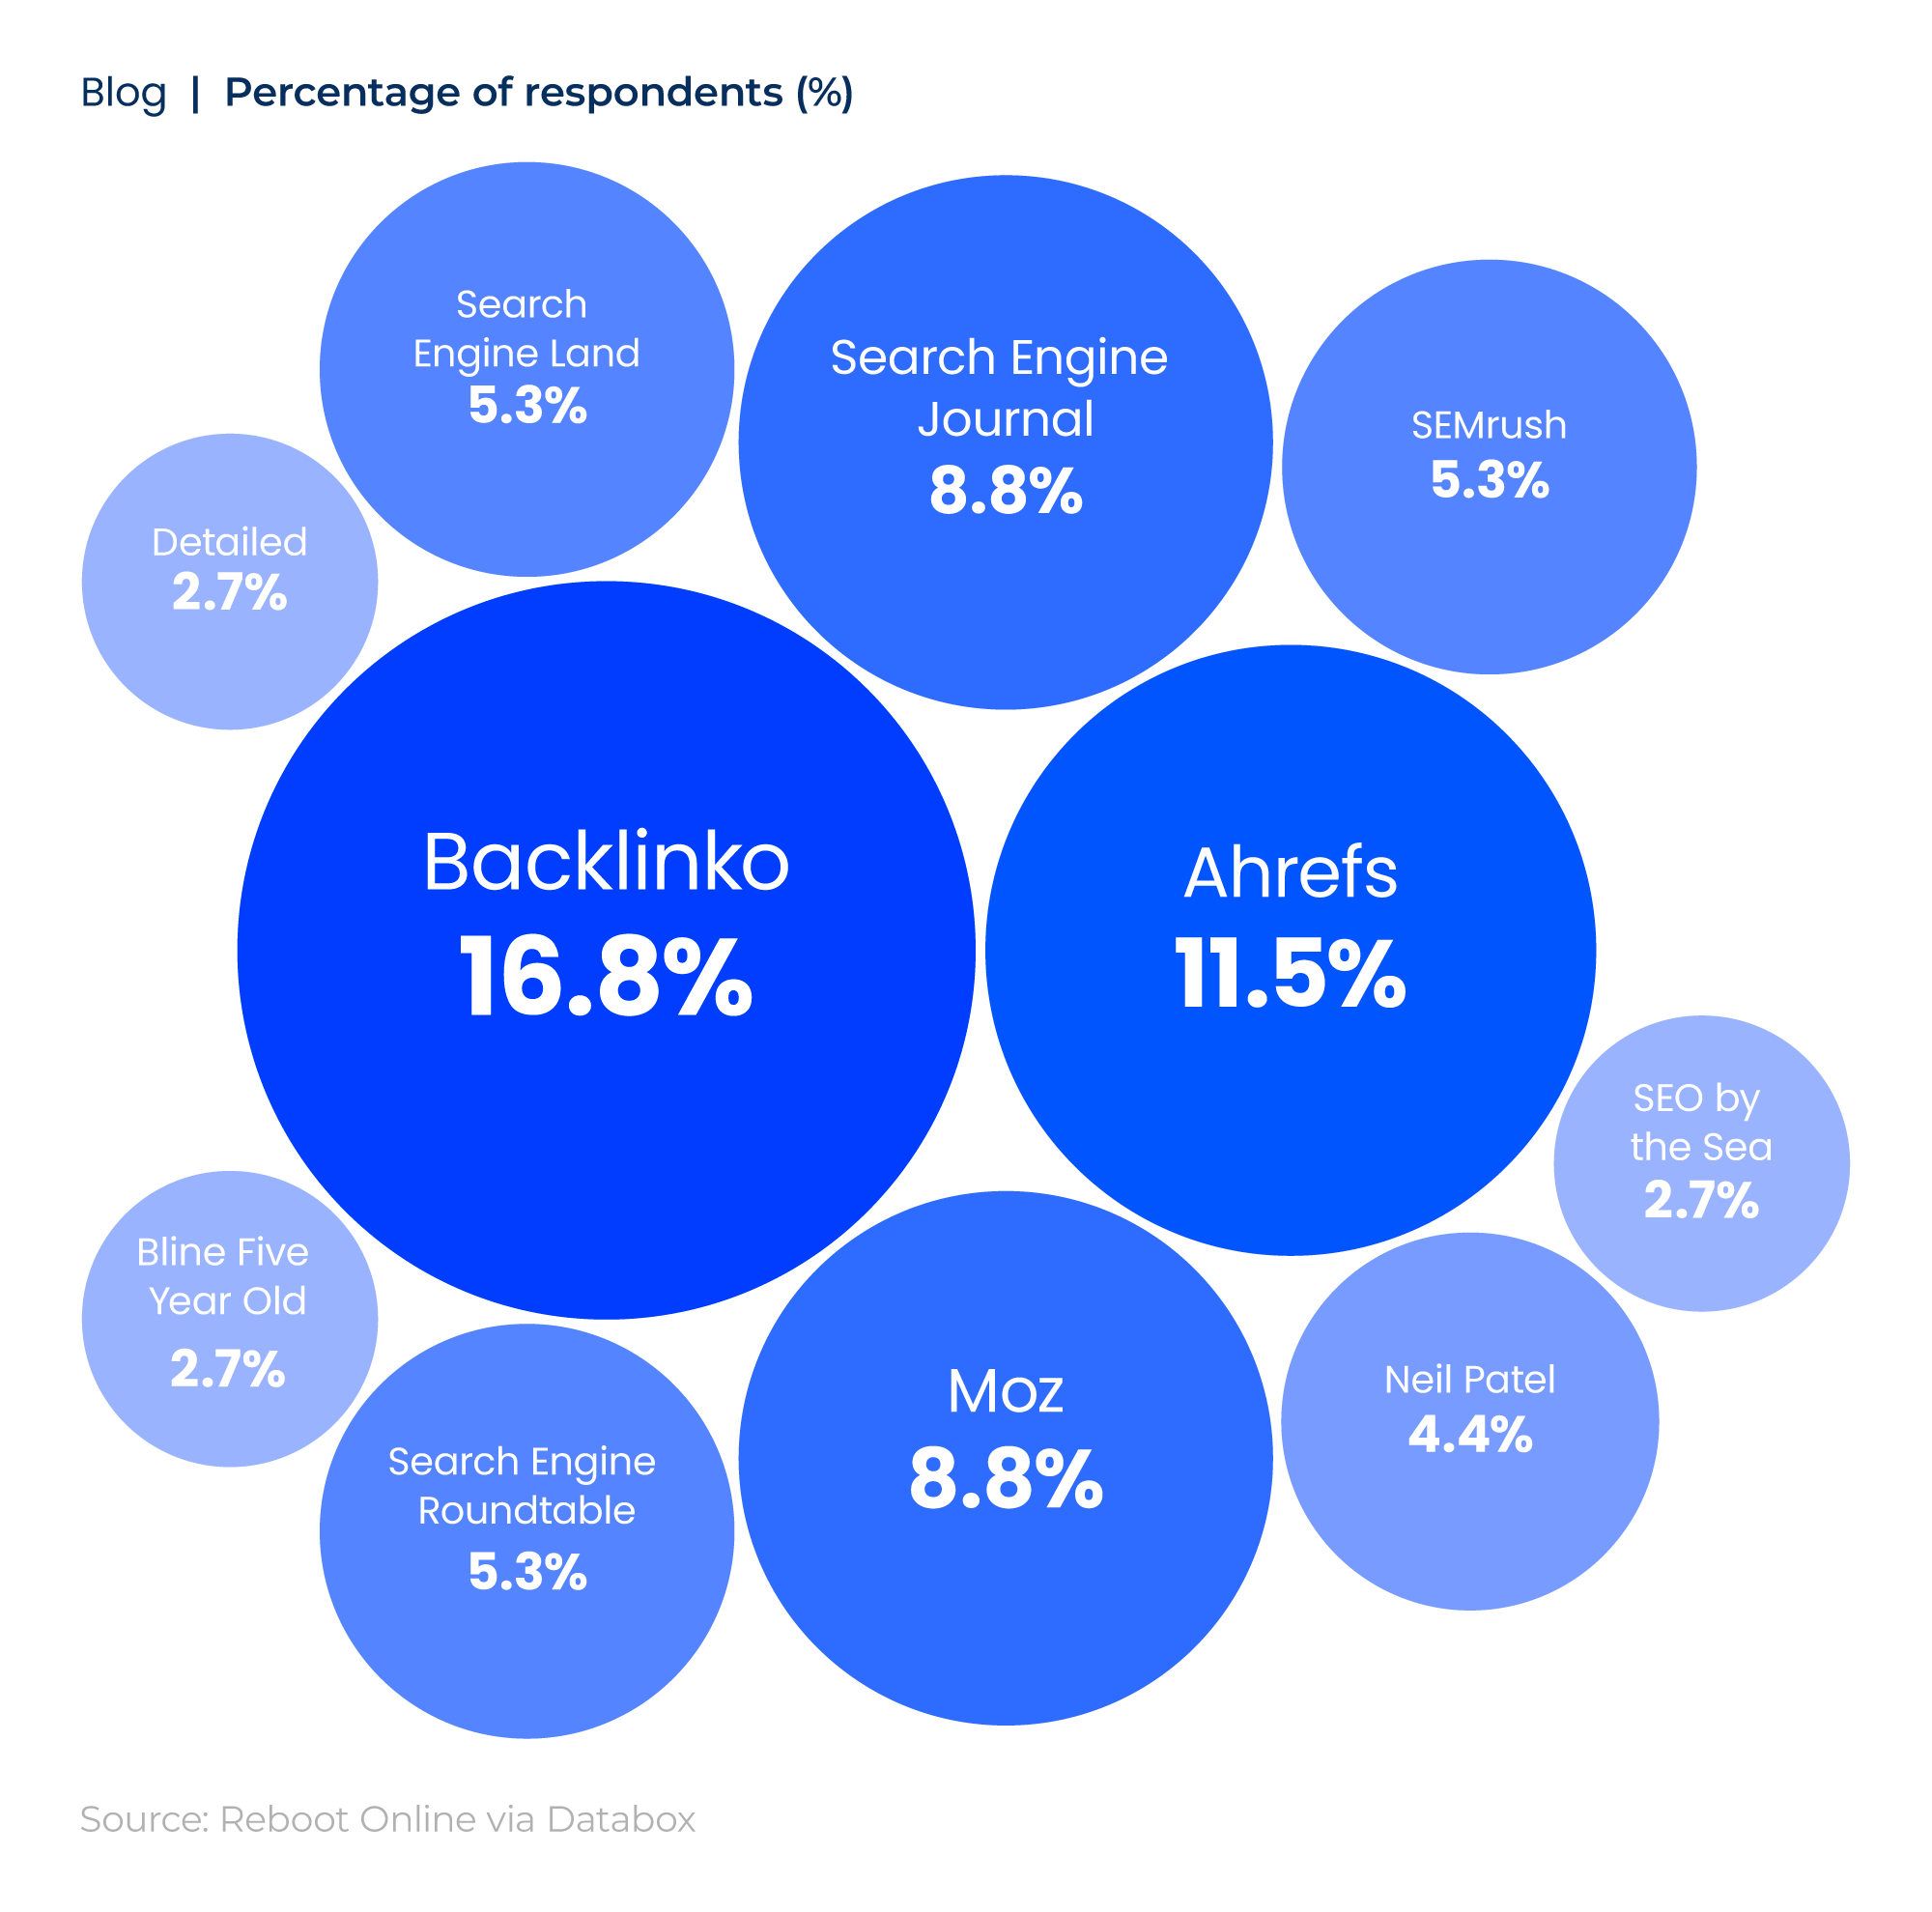
Backlinko is the most recommended SEO blog of 2026, according to Databox survey data, at 16.8%.
This was followed by 11.5% who recommended Ahrefs and 8.8% who opted for Moz and Search Engine Journal.
SEO statistics FAQs
What is the SEO market size in 2026?
As of 2026, the SEO market size is estimated to be worth around $83.9 billion.
What is Google’s search engine market share?
In March 2026, Google had a search engine market share of 89.85% worldwide across all devices.
What is the average SEO salary in the UK?
Analysis by Reboot Online shows that the median average SEO salary in the UK between 2025 and 2026 is around £39,719, with a mean average of £43,426.
How much does SEO cost?
According to internal data from GEO agency Reboot Online, the average SEO cost in 2025 was around £6,820 per client. However, this is influenced by several factors, such as:
-
The level of market competitiveness and the industry you work in.
-
The scope of work needed (i.e., the degree of content creation, link building, and technical SEO required).
-
Geographical scale and location (local vs national or international SEO).
-
Who is doing the work for you (i.e., freelancers vs an SEO agency).
-
Timescale (fast, rapid success vs long-term, sustained growth).
How much does SEO cost for a small business?
SEO cost statistics from Nutshell show that the average cost of SEO for a small business is usually between $1,500 and $3,000 per month.
Startups tend to spend around half of this per month ($750 to $1,500), rising to more than $5,000 a month for a typical enterprise.
How much should I spend on SEO per month?
The amount you spend on SEO per month ultimately depends on what services you want, the size of your business, and your main goals and priorities. For example, the average client for Reboot Online spent around £4,010 on SEO consultancy in 2025. This was more than half the typical SEO spend on digital PR services (£8,161).
Likewise, in the US, the average price of SEO services ranges from $0.15 to $0.50 per word for SEO copywriting, up to $30,000 or more for a one-time SEO project.
What is the average ROI for SEO?
SEO research by Website Builder Expert shows that SEO marketing has an average ROI of 22:1, with a 5:1 ratio considered an industry benchmark for effective marketing.
This is supported by SEO stats from ACCESS Newswire Inc., which claims that SEO campaigns can generate more than 700% ROI in some industries.
What is the average eCommerce SEO conversion rate?
The average eCommerce SEO conversion rate stood at 2.31% as of March 2026, according to SEO statistics from Dynamic Yield.
This varies by device, ranging from 1.89% on desktops to 2.61% for tablets.
What is the average CTR for SEO?
Findings from Backlinko show that a CTR of at least 3% is considered good for SEO. This suggests that for every 100 people who visit your site, three will click through.
That said, the top result in Google’s organic search results has an average CTR of 27.6%, making it around 10 times more likely to receive clicks than those in positions nine or 10.
Sources
https://www.forbes.com/advisor/business/software/seo-statistics
https://bestaccreditedcolleges.org/articles/seo-specialist-job-description-salary-training
https://www.nutshell.com/marketing/resources/cost-of-seo
https://databox.com/seo-statistics
https://ahrefs.com/blog/seo-pricing/
https://blog.hubspot.com/marketing/hubspot-blog-marketing-industry-trends-report
https://www.websitebuilderexpert.com/marketing/digital-marketing-roi-statistics
https://databox.com/how-long-does-seo-take
https://hubspot-state-of-marketing-2026.replit.app
https://userp.io/link-building/state-of-backlinks-for-seo
https://backlinko.com/search-engine-ranking
https://www.reviewtrackers.com/reports/local-search/
https://www.rebootonline.com/seo-statistics/ecommerce-seo-statistics
https://openai.com/index/scaling-ai-for-everyone/
https://marketing.dynamicyield.com/benchmarks
https://backlinko.com/google-user-behavior
https://backlinko.com/google-ctr-stats
https://backlinko.com/content-study
https://cxl.com/guides/click-through-rate/benchmarks
https://gs.statcounter.com/platform-market-share/desktop-mobile-tablet
https://www.gwi.com/blog/voice-search-trends
https://www.yadavbikash.com/blogs/voice-search-statistics
https://backlinko.com/voice-search-seo-study
https://backlinko.com/seo-services-statistics
https://datareportal.com/reports/digital-2026-global-overview-report
https://www.kapwing.com/resources/115-video-marketing-statistics-for-creators-2026
https://wyzowl.com/video-marketing-statistics
https://databox.com/best-structured-data-tools
https://seranking.com/blog/seo-issues
https://gs.statcounter.com/search-engine-market-share
https://blog.google/products/ads-commerce/ai-personalization-and-the-future-of-shopping
https://www.google.com/search/howsearchworks/how-search-works/organizing-information
https://www.macrotrends.net/stocks/charts/GOOG/alphabet/revenue
https://www.searchenginejournal.com/google-algorithm-history/
https://www.similarweb.com/blog/marketing/seo/top-keywords/
https://blog.google/company-news/inside-google/message-ceo/alphabet-earnings-q2-2025
https://www.semrush.com/trending-websites/global/all
https://www.semrush.com/blog/semrush-ai-overviews-study
https://www.semrush.com/news/288870-new-report-reveals-the-top-ai-content-and-seo-trends-for-2024
https://www.semrush.com/blog/ai-search-seo-traffic-study
https://blog.hubspot.com/marketing/evolution-of-search
https://databox.com/best-seo-blogs
Methodology
Average cost of SEO services
Invoices were taken between November 2024 and October 2025 for Reboot Online clients who paid for SEO services. An overall average SEO cost was calculated and then broken down by service (such as consultancy, content marketing, and digital PR).
Average SEO salary statistics
Reboot’s internal job data was used to analyse SEO job trends in the UK since the start of 2025.
This data is periodically scraped from job listing websites, such as Indeed and LinkedIn, and currently has more than a million historical job adverts.
The fuzzy matching method was used to find SEO-related job adverts that matched or exceeded the 85% threshold for each job title from the list.
Salary data was aggregated to find which SEO jobs earned the most over the last year and which location had the most SEO job listings. The data was also divided into remote and non-remote jobs to examine the impact on average SEO salary statistics.
Search engine market share statistics over time
Data were collected from Statcounter to analyse how search engine market share has changed over time (2017-26) and to identify which search engines dominate the global market.
Data was collected for each month between 2017 and 2026, and then a mean was calculated for each year. This data was then plotted to show trends over time.
SEO search trends over time
A seed list was taken from the 100 most-searched keywords in Ahrefs that included the term ‘SEO’. From this, the most relevant items were filtered to include those directly related to a particular SEO aspect or a specific SEO service, including synonyms and variations of those terms.
These were input into Google Trends to judge the relative popularity of each term.
Those with an historical index score of 0 were removed, leaving a list of 11 keywords related to SEO.
The relative search interest for each keyword was collected for each year between 2004 and 2025 and forecasted through 2030 to show future search trends.
Forecasting was done using Reboot’s built-in forecasting tool, which fits multiple forecasting models per keyword and runs backtests to evaluate model performance and find the best-fitting model for each time series. In this case, SARIMAX and exponential smoothing algorithms were used to predict future trends in the data.
SEO sentiment analysis
All posts and comments from 2026 were scraped from the four largest SEO subreddits to gauge sentiment towards SEO.
This data was filtered using a list of more than 100 SEO-related keywords to identify posts and comments specifically about SEO.
A count for each keyword was then used to find the most talked-about SEO topics for 2026.
The filtered data was hierarchically structured using parent and comment IDs to get the average sentiment for the comment/post chain, not just individual comments.
Average sentiment scores were calculated for each subreddit post and comment using VADER to obtain positive, negative, and neutral sentiment scores. These ranged from -1 to +1 using the following scores:
Positive sentiment score: compound score >= 0.05
Neutral sentiment score: (compound score > -0.05) and (compound score < 0.05)
Negative sentiment score: compound score <+ -0.05
Note: The above scores are based on a single sentence. When analysing the data, it’s important to note that the compound sentiment score of a subreddit is the average of all posts, so values will be higher in most cases.
Subreddits with lower scores will, on average, have more negative conversations across topics.